29
/
en
AIzaSyAYiBZKx7MnpbEhh9jyipgxe19OcubqV5w
April 1, 2024
240851
Singapore
SGP
true
2
1
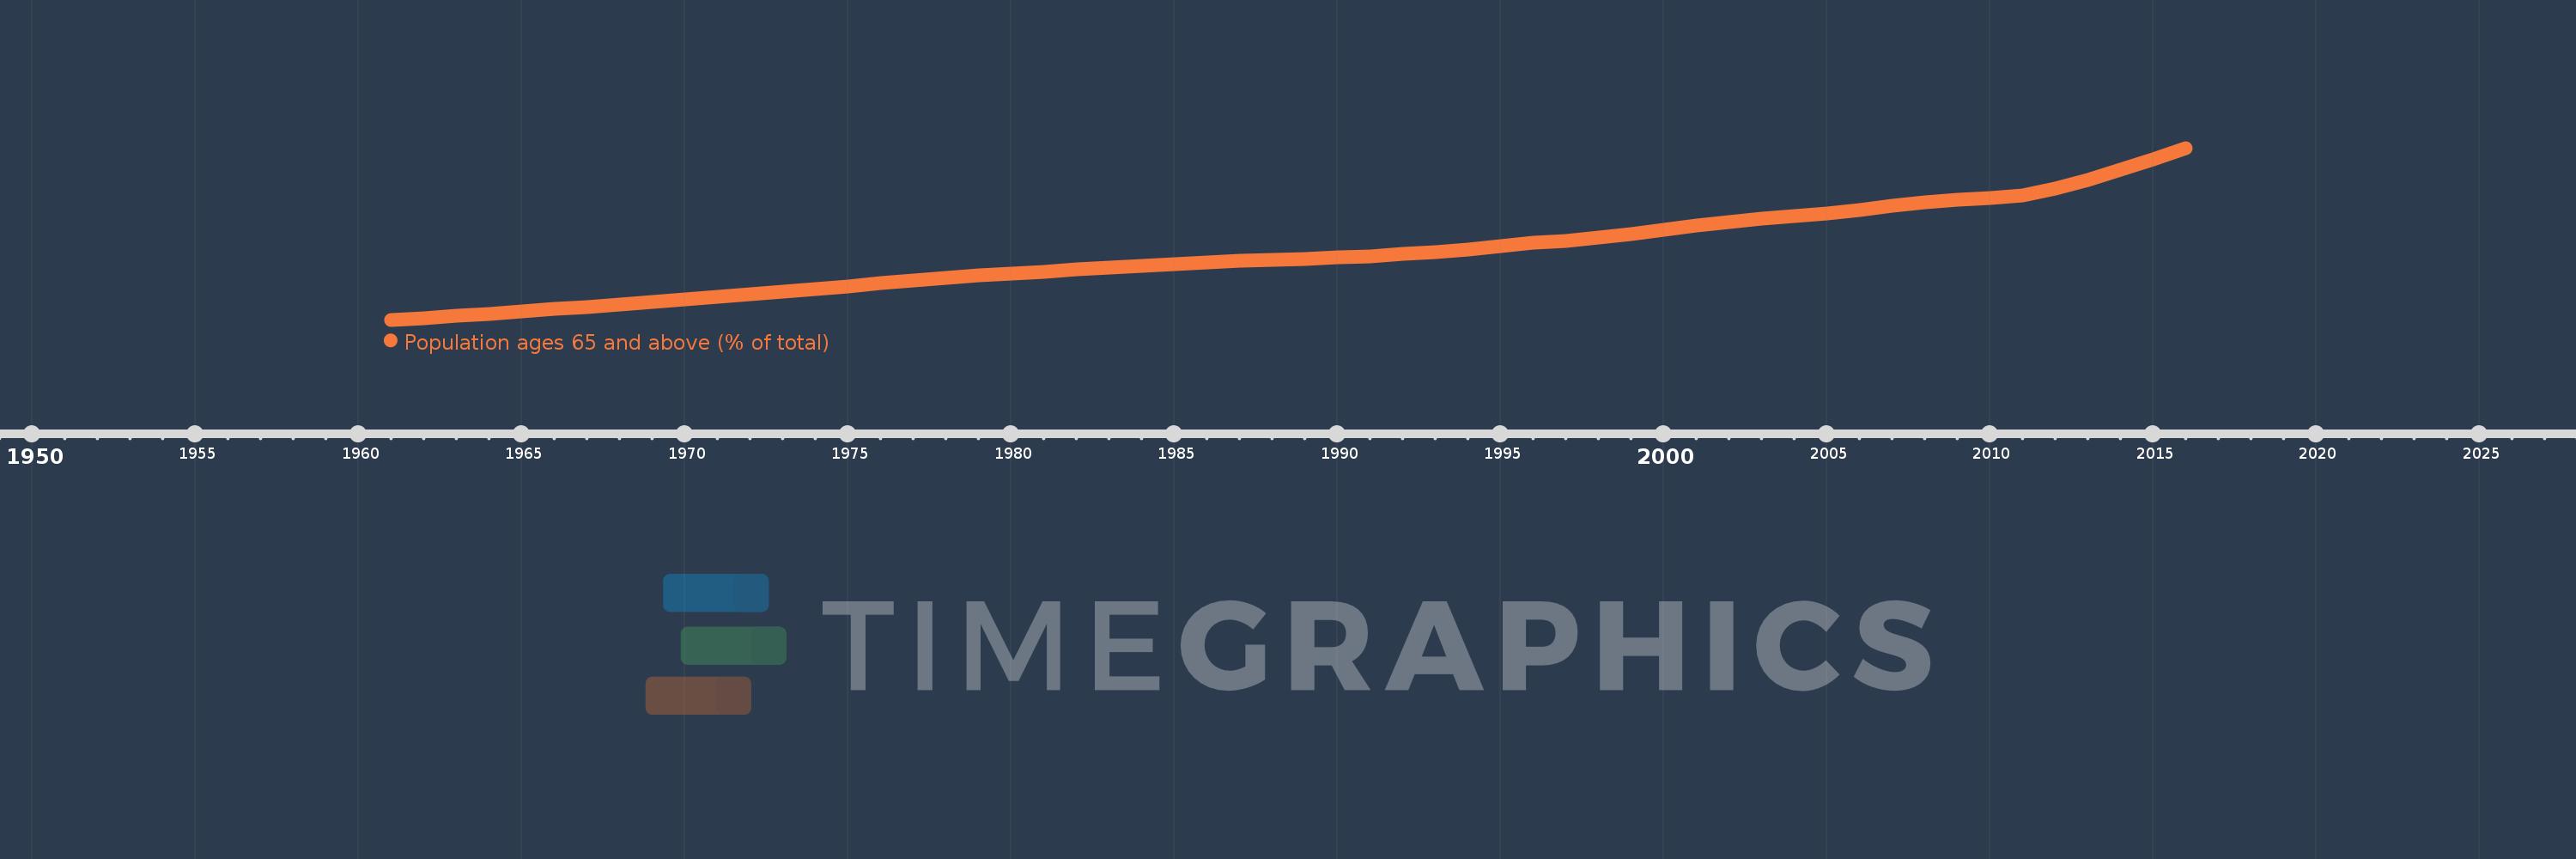
Population ages 65 and above (% of total)
2016,2015,2014,2013,2012,2011,2010,2009,2008,2007,2006,2005,2004,2003,2002,2001,2000,1999,1998,1997,1996,1995,1994,1993,1992,1991,1990,1989,1988,1987,1986,1985,1984,1983,1982,1981,1980,1979,1978,1977,1976,1975,1974,1973,1972,1971,1970,1969,1968,1967,1966,1965,1964,1963,1962,1961
This statistics in other country:
AfghanistanAlbaniaAlgeriaAngolaAntigua and BarbudaArab WorldArgentinaArmeniaArubaAustraliaAustriaAzerbaijanBahamas, TheBahrainBangladeshBarbadosBelarusBelgiumBelizeBeninBhutanBoliviaBosnia and HerzegovinaBotswanaBrazilBrunei DarussalamBulgariaBurkina FasoBurundiCabo VerdeCambodiaCameroonCanadaCaribbean small statesCentral African RepublicCentral Europe and the BalticsChadChannel IslandsChileChinaColombiaComorosCongo, Dem. Rep.Congo, Rep.Costa RicaCote d'IvoireCroatiaCubaCuracaoCyprusCzech RepublicDenmarkDjiboutiDominican RepublicEarly-demographic dividendEast Asia & PacificEast Asia & Pacific (excluding high income)East Asia & Pacific (IDA & IBRD countries)EcuadorEgypt, Arab Rep.El SalvadorEquatorial GuineaEritreaEstoniaEthiopiaEuro areaEurope & Central AsiaEurope & Central Asia (excluding high income)Europe & Central Asia (IDA & IBRD countries)European UnionFijiFinlandFragile and conflict affected situationsFranceFrench PolynesiaGabonGambia, TheGeorgiaGermanyGhanaGreeceGrenadaGuamGuatemalaGuineaGuinea-BissauGuyanaHaitiHeavily indebted poor countries (HIPC)High incomeHondurasHong Kong SAR, ChinaHungaryIBRD onlyIcelandIDA & IBRD totalIDA blendIDA onlyIDA totalIndiaIndonesiaIran, Islamic Rep.IraqIrelandIsraelItalyJamaicaJapanJordanKazakhstanKenyaKiribatiKorea, Dem. People’s Rep.Korea, Rep.KosovoKuwaitKyrgyz RepublicLao PDRLate-demographic dividendLatin America & Caribbean Latin America & Caribbean (excluding high income)Latin America & the Caribbean (IDA & IBRD countries)LatviaLeast developed countries: UN classificationLebanonLesothoLiberiaLibyaLithuaniaLow & middle incomeLow incomeLower middle incomeLuxembourgMacao SAR, ChinaMacedonia, FYRMadagascarMalawiMalaysiaMaldivesMaliMaltaMauritaniaMauritiusMexicoMicronesia, Fed. Sts.Middle East & North AfricaMiddle East & North Africa (excluding high income)Middle East & North Africa (IDA & IBRD countries)Middle incomeMoldovaMongoliaMontenegroMoroccoMozambiqueMyanmarNamibiaNepalNetherlandsNew CaledoniaNew ZealandNicaraguaNigerNigeriaNorth AmericaNorwayOECD membersOmanOther small statesPacific island small statesPakistanPanamaPapua New GuineaParaguayPeruPhilippinesPolandPortugalPost-demographic dividendPre-demographic dividendPuerto RicoQatarRomaniaRussian FederationRwandaSamoaSao Tome and PrincipeSaudi ArabiaSenegalSerbiaSeychellesSierra LeoneSingaporeSlovak RepublicSloveniaSmall statesSolomon IslandsSomaliaSouth AfricaSouth AsiaSouth Asia (IDA & IBRD)South SudanSpainSri LankaSt. LuciaSt. Vincent and the GrenadinesSub-Saharan Africa Sub-Saharan Africa (excluding high income)Sub-Saharan Africa (IDA & IBRD countries)SudanSurinameSwazilandSwedenSwitzerlandSyrian Arab RepublicTajikistanTanzaniaThailandTimor-LesteTogoTongaTrinidad and TobagoTunisiaTurkeyTurkmenistanUgandaUkraineUnited Arab EmiratesUnited KingdomUnited StatesUpper middle incomeUruguayUzbekistanVanuatuVenezuela, RBVietnamVirgin Islands (U.S.)West Bank and GazaWorldYemen, Rep.ZambiaZimbabwe Timeline:
This timeline shows a graph from 1961 to 2016 of Singapore. No data until 1960. Number of actual observations by date: 56.
Source name:
World Development Indicators
Source organization:
World Bank staff estimates based on age distributions of United Nations Population Division's World Population Prospects.
Categories, topics:
Health
Last updated:
apr 23, 2017
Indicators value changes by year
Maximum:
11.681
jan 1, 2016
At the date of observation
Value
Absolute change
Change from previous value
jan 1, 1961
2.044
+2.044
0.0%
jan 1, 1962
2.138
+0.095
4.63%
jan 1, 1963
2.252
+0.113
5.31%
jan 1, 1964
2.377
+0.125
5.54%
jan 1, 1965
2.508
+0.132
5.54%
jan 1, 1966
2.647
+0.139
5.54%
jan 1, 1967
2.768
+0.121
4.56%
jan 1, 1968
2.898
+0.13
4.68%
jan 1, 1969
3.035
+0.137
4.74%
jan 1, 1970
3.178
+0.143
4.72%
jan 1, 1971
3.326
+0.148
4.67%
jan 1, 1972
3.476
+0.149
4.49%
jan 1, 1973
3.62
+0.144
4.15%
jan 1, 1974
3.769
+0.149
4.12%
jan 1, 1975
3.932
+0.163
4.32%
jan 1, 1976
4.108
+0.176
4.47%
jan 1, 1977
4.242
+0.135
3.28%
jan 1, 1978
4.383
+0.141
3.32%
jan 1, 1979
4.518
+0.135
3.09%
jan 1, 1980
4.632
+0.114
2.53%
jan 1, 1981
4.72
+0.088
1.89%
jan 1, 1982
4.849
+0.128
2.72%
jan 1, 1983
4.96
+0.111
2.29%
jan 1, 1984
5.06
+0.101
2.03%
jan 1, 1985
5.162
+0.102
2.02%
jan 1, 1986
5.274
+0.111
2.16%
jan 1, 1987
5.337
+0.063
1.2%
jan 1, 1988
5.398
+0.062
1.16%
jan 1, 1989
5.463
+0.064
1.19%
jan 1, 1990
5.528
+0.066
1.2%
jan 1, 1991
5.592
+0.064
1.16%
jan 1, 1992
5.721
+0.129
2.3%
jan 1, 1993
5.857
+0.136
2.38%
jan 1, 1994
6.001
+0.144
2.46%
jan 1, 1995
6.161
+0.159
2.66%
jan 1, 1996
6.344
+0.183
2.97%
jan 1, 1997
6.483
+0.14
2.2%
jan 1, 1998
6.656
+0.173
2.66%
jan 1, 1999
6.862
+0.206
3.09%
jan 1, 2000
7.092
+0.23
3.35%
jan 1, 2001
7.337
+0.245
3.46%
jan 1, 2002
7.521
+0.184
2.51%
jan 1, 2003
7.694
+0.173
2.3%
jan 1, 2004
7.845
+0.151
1.96%
jan 1, 2005
8.002
+0.157
2.0%
jan 1, 2006
8.221
+0.219
2.73%
jan 1, 2007
8.449
+0.228
2.78%
jan 1, 2008
8.643
+0.194
2.3%
jan 1, 2009
8.781
+0.137
1.59%
jan 1, 2010
8.884
+0.104
1.18%
jan 1, 2011
9.011
+0.127
1.43%
jan 1, 2012
9.413
+0.402
4.46%
jan 1, 2013
9.9
+0.487
5.17%
jan 1, 2014
10.454
+0.554
5.6%
jan 1, 2015
11.052
+0.597
5.71%
jan 1, 2016
11.681
+0.629
5.69%
Ranking of countries by current statistics by years


Comments: