29
/
en
AIzaSyAYiBZKx7MnpbEhh9jyipgxe19OcubqV5w
April 1, 2024
54360
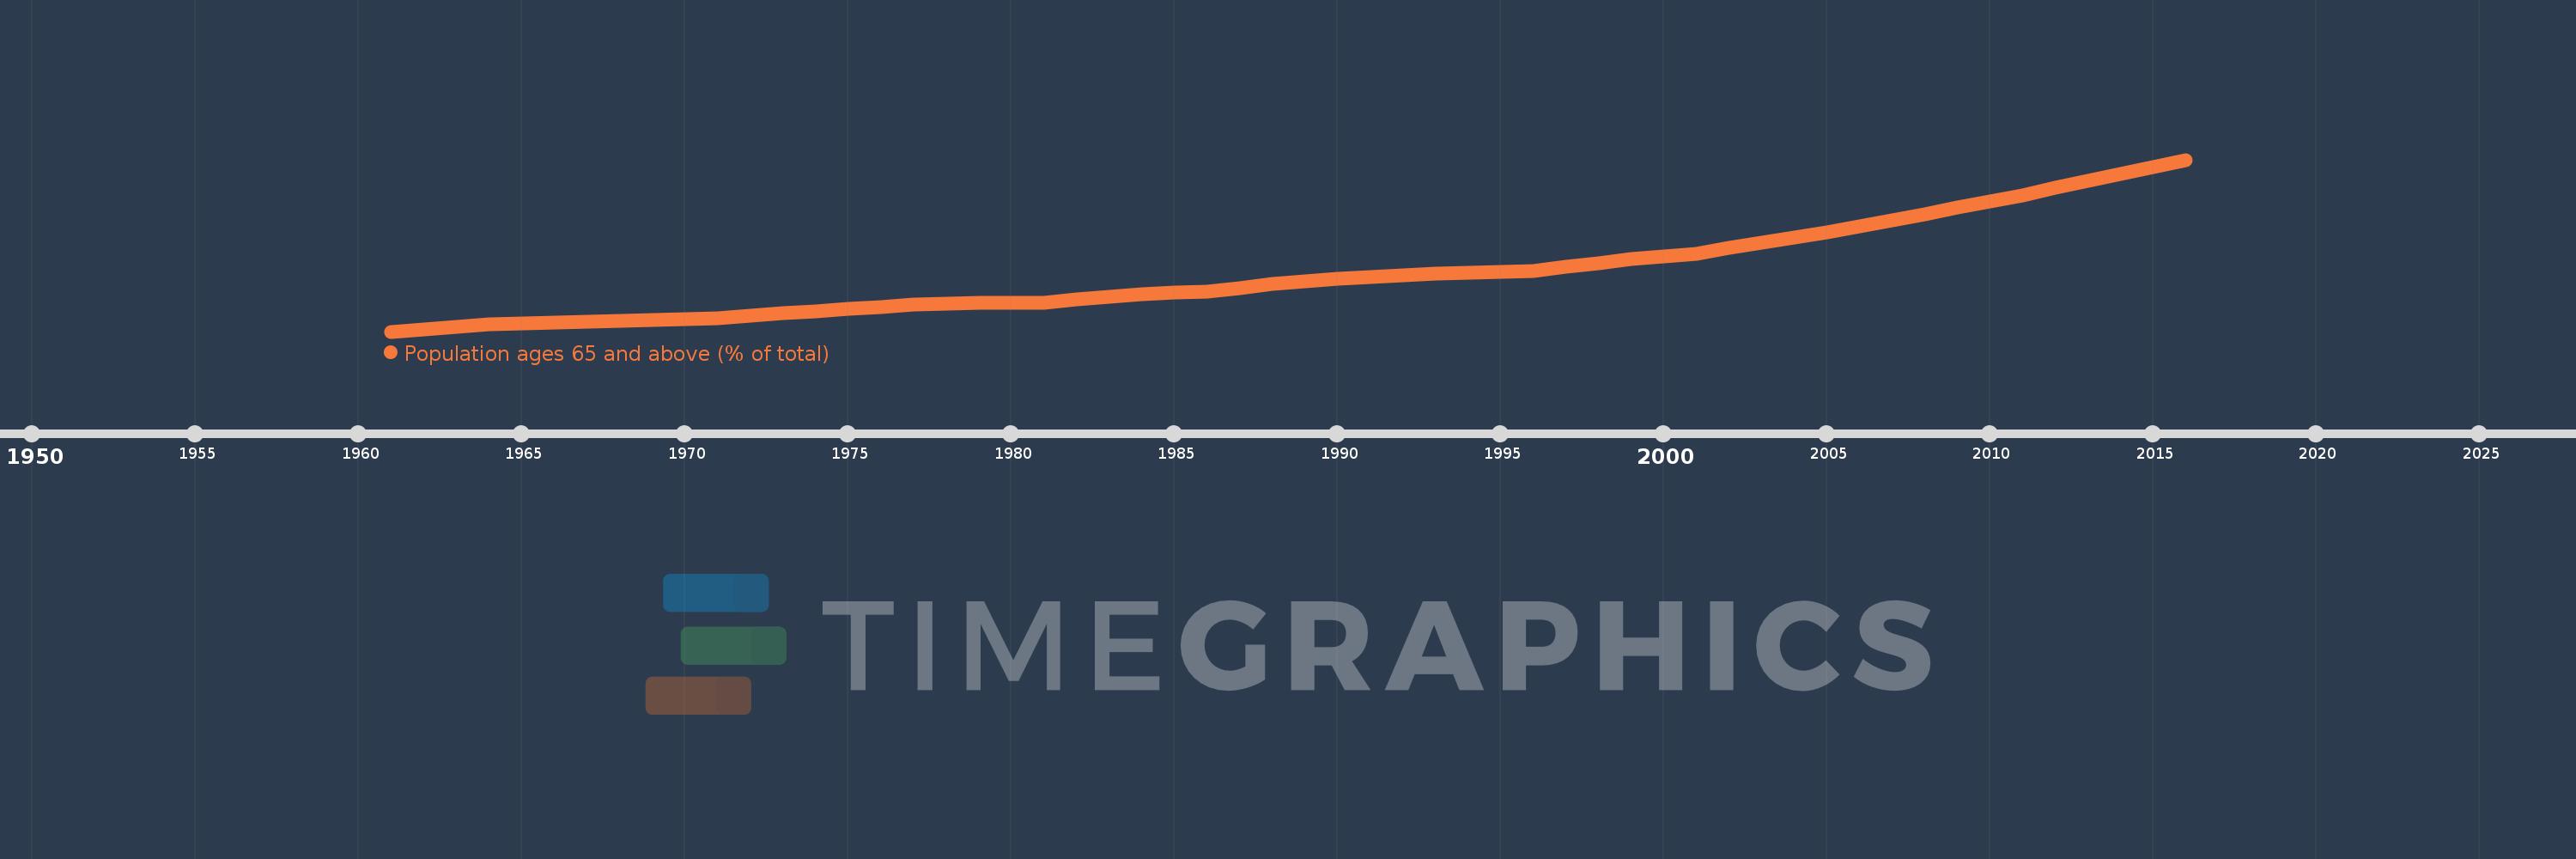
Pacific island small states
PSS
false
2
1
Population ages 65 and above (% of total)
2016,2015,2014,2013,2012,2011,2010,2009,2008,2007,2006,2005,2004,2003,2002,2001,2000,1999,1998,1997,1996,1995,1994,1993,1992,1991,1990,1989,1988,1987,1986,1985,1984,1983,1982,1981,1980,1979,1978,1977,1976,1975,1974,1973,1972,1971,1970,1969,1968,1967,1966,1965,1964,1963,1962,1961
This statistics in other country:
AfghanistanAlbaniaAlgeriaAngolaAntigua and BarbudaArab WorldArgentinaArmeniaArubaAustraliaAustriaAzerbaijanBahamas, TheBahrainBangladeshBarbadosBelarusBelgiumBelizeBeninBhutanBoliviaBosnia and HerzegovinaBotswanaBrazilBrunei DarussalamBulgariaBurkina FasoBurundiCabo VerdeCambodiaCameroonCanadaCaribbean small statesCentral African RepublicCentral Europe and the BalticsChadChannel IslandsChileChinaColombiaComorosCongo, Dem. Rep.Congo, Rep.Costa RicaCote d'IvoireCroatiaCubaCuracaoCyprusCzech RepublicDenmarkDjiboutiDominican RepublicEarly-demographic dividendEast Asia & PacificEast Asia & Pacific (excluding high income)East Asia & Pacific (IDA & IBRD countries)EcuadorEgypt, Arab Rep.El SalvadorEquatorial GuineaEritreaEstoniaEthiopiaEuro areaEurope & Central AsiaEurope & Central Asia (excluding high income)Europe & Central Asia (IDA & IBRD countries)European UnionFijiFinlandFragile and conflict affected situationsFranceFrench PolynesiaGabonGambia, TheGeorgiaGermanyGhanaGreeceGrenadaGuamGuatemalaGuineaGuinea-BissauGuyanaHaitiHeavily indebted poor countries (HIPC)High incomeHondurasHong Kong SAR, ChinaHungaryIBRD onlyIcelandIDA & IBRD totalIDA blendIDA onlyIDA totalIndiaIndonesiaIran, Islamic Rep.IraqIrelandIsraelItalyJamaicaJapanJordanKazakhstanKenyaKiribatiKorea, Dem. People’s Rep.Korea, Rep.KosovoKuwaitKyrgyz RepublicLao PDRLate-demographic dividendLatin America & Caribbean Latin America & Caribbean (excluding high income)Latin America & the Caribbean (IDA & IBRD countries)LatviaLeast developed countries: UN classificationLebanonLesothoLiberiaLibyaLithuaniaLow & middle incomeLow incomeLower middle incomeLuxembourgMacao SAR, ChinaMacedonia, FYRMadagascarMalawiMalaysiaMaldivesMaliMaltaMauritaniaMauritiusMexicoMicronesia, Fed. Sts.Middle East & North AfricaMiddle East & North Africa (excluding high income)Middle East & North Africa (IDA & IBRD countries)Middle incomeMoldovaMongoliaMontenegroMoroccoMozambiqueMyanmarNamibiaNepalNetherlandsNew CaledoniaNew ZealandNicaraguaNigerNigeriaNorth AmericaNorwayOECD membersOmanOther small statesPacific island small statesPakistanPanamaPapua New GuineaParaguayPeruPhilippinesPolandPortugalPost-demographic dividendPre-demographic dividendPuerto RicoQatarRomaniaRussian FederationRwandaSamoaSao Tome and PrincipeSaudi ArabiaSenegalSerbiaSeychellesSierra LeoneSingaporeSlovak RepublicSloveniaSmall statesSolomon IslandsSomaliaSouth AfricaSouth AsiaSouth Asia (IDA & IBRD)South SudanSpainSri LankaSt. LuciaSt. Vincent and the GrenadinesSub-Saharan Africa Sub-Saharan Africa (excluding high income)Sub-Saharan Africa (IDA & IBRD countries)SudanSurinameSwazilandSwedenSwitzerlandSyrian Arab RepublicTajikistanTanzaniaThailandTimor-LesteTogoTongaTrinidad and TobagoTunisiaTurkeyTurkmenistanUgandaUkraineUnited Arab EmiratesUnited KingdomUnited StatesUpper middle incomeUruguayUzbekistanVanuatuVenezuela, RBVietnamVirgin Islands (U.S.)West Bank and GazaWorldYemen, Rep.ZambiaZimbabwe Timeline:
This timeline shows a graph from 1961 to 2016 of Pacific island small states. No data until 1960. Number of actual observations by date: 56.
Source name:
World Development Indicators
Source organization:
World Bank staff estimates based on age distributions of United Nations Population Division's World Population Prospects.
Categories, topics:
Health
Last updated:
apr 23, 2017
Indicators value changes by year
At the date of observation
Value
Absolute change
Change from previous value
jan 1, 1961
2.475
+2.475
0.0%
jan 1, 1962
2.499
+0.024
0.96%
jan 1, 1963
2.535
+0.036
1.44%
jan 1, 1964
2.568
+0.033
1.31%
jan 1, 1965
2.588
+0.02
0.77%
jan 1, 1966
2.591
+0.003
0.11%
jan 1, 1967
2.612
+0.021
0.82%
jan 1, 1968
2.624
+0.012
0.45%
jan 1, 1969
2.632
+0.008
0.3%
jan 1, 1970
2.641
+0.01
0.37%
jan 1, 1971
2.656
+0.015
0.57%
jan 1, 1972
2.689
+0.032
1.22%
jan 1, 1973
2.72
+0.031
1.14%
jan 1, 1974
2.748
+0.029
1.06%
jan 1, 1975
2.777
+0.029
1.05%
jan 1, 1976
2.808
+0.031
1.13%
jan 1, 1977
2.834
+0.026
0.92%
jan 1, 1978
2.852
+0.018
0.63%
jan 1, 1979
2.862
+0.01
0.34%
jan 1, 1980
2.863
+0.001
0.05%
jan 1, 1981
2.859
-0.004
-0.14%
jan 1, 1982
2.904
+0.044
1.56%
jan 1, 1983
2.943
+0.039
1.34%
jan 1, 1984
2.974
+0.032
1.08%
jan 1, 1985
2.996
+0.022
0.74%
jan 1, 1986
3.009
+0.012
0.41%
jan 1, 1987
3.063
+0.055
1.82%
jan 1, 1988
3.112
+0.049
1.59%
jan 1, 1989
3.154
+0.042
1.34%
jan 1, 1990
3.185
+0.031
1.0%
jan 1, 1991
3.207
+0.022
0.68%
jan 1, 1992
3.237
+0.03
0.95%
jan 1, 1993
3.256
+0.018
0.56%
jan 1, 1994
3.266
+0.011
0.33%
jan 1, 1995
3.275
+0.008
0.26%
jan 1, 1996
3.286
+0.012
0.35%
jan 1, 1997
3.342
+0.056
1.69%
jan 1, 1998
3.398
+0.056
1.67%
jan 1, 1999
3.449
+0.052
1.52%
jan 1, 2000
3.49
+0.04
1.17%
jan 1, 2001
3.519
+0.029
0.83%
jan 1, 2002
3.597
+0.079
2.23%
jan 1, 2003
3.669
+0.071
1.98%
jan 1, 2004
3.739
+0.07
1.92%
jan 1, 2005
3.813
+0.074
1.99%
jan 1, 2006
3.894
+0.081
2.12%
jan 1, 2007
3.974
+0.08
2.06%
jan 1, 2008
4.057
+0.083
2.09%
jan 1, 2009
4.144
+0.086
2.13%
jan 1, 2010
4.23
+0.086
2.08%
jan 1, 2011
4.311
+0.081
1.93%
jan 1, 2012
4.405
+0.094
2.17%
jan 1, 2013
4.499
+0.094
2.13%
jan 1, 2014
4.594
+0.095
2.11%
jan 1, 2015
4.689
+0.095
2.07%
jan 1, 2016
4.786
+0.097
2.08%
Ranking of countries by current statistics by years


Comments: