29
/
en
AIzaSyAYiBZKx7MnpbEhh9jyipgxe19OcubqV5w
April 1, 2024
164140
Japan
JPN
true
2
1
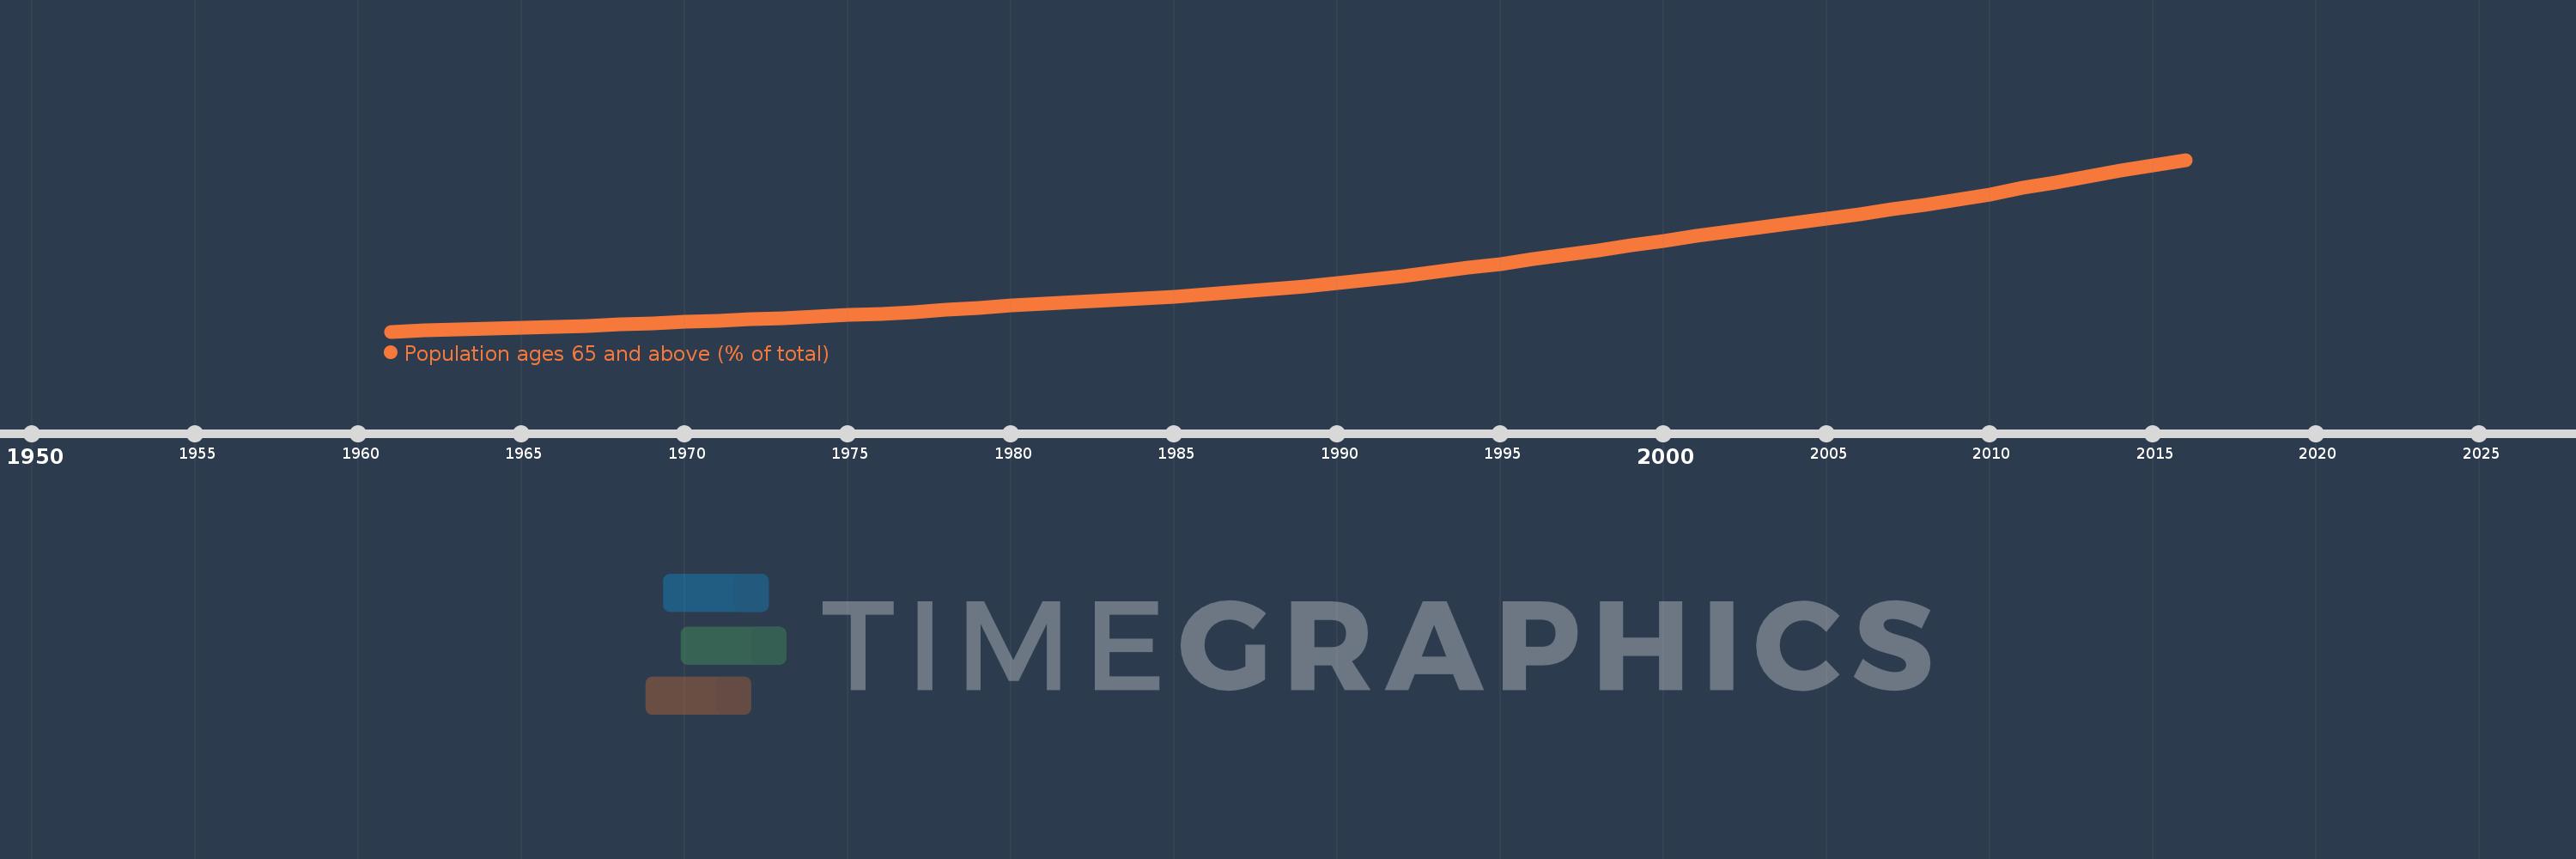
Population ages 65 and above (% of total)
2016,2015,2014,2013,2012,2011,2010,2009,2008,2007,2006,2005,2004,2003,2002,2001,2000,1999,1998,1997,1996,1995,1994,1993,1992,1991,1990,1989,1988,1987,1986,1985,1984,1983,1982,1981,1980,1979,1978,1977,1976,1975,1974,1973,1972,1971,1970,1969,1968,1967,1966,1965,1964,1963,1962,1961
This statistics in other country:
AfghanistanAlbaniaAlgeriaAngolaAntigua and BarbudaArab WorldArgentinaArmeniaArubaAustraliaAustriaAzerbaijanBahamas, TheBahrainBangladeshBarbadosBelarusBelgiumBelizeBeninBhutanBoliviaBosnia and HerzegovinaBotswanaBrazilBrunei DarussalamBulgariaBurkina FasoBurundiCabo VerdeCambodiaCameroonCanadaCaribbean small statesCentral African RepublicCentral Europe and the BalticsChadChannel IslandsChileChinaColombiaComorosCongo, Dem. Rep.Congo, Rep.Costa RicaCote d'IvoireCroatiaCubaCuracaoCyprusCzech RepublicDenmarkDjiboutiDominican RepublicEarly-demographic dividendEast Asia & PacificEast Asia & Pacific (excluding high income)East Asia & Pacific (IDA & IBRD countries)EcuadorEgypt, Arab Rep.El SalvadorEquatorial GuineaEritreaEstoniaEthiopiaEuro areaEurope & Central AsiaEurope & Central Asia (excluding high income)Europe & Central Asia (IDA & IBRD countries)European UnionFijiFinlandFragile and conflict affected situationsFranceFrench PolynesiaGabonGambia, TheGeorgiaGermanyGhanaGreeceGrenadaGuamGuatemalaGuineaGuinea-BissauGuyanaHaitiHeavily indebted poor countries (HIPC)High incomeHondurasHong Kong SAR, ChinaHungaryIBRD onlyIcelandIDA & IBRD totalIDA blendIDA onlyIDA totalIndiaIndonesiaIran, Islamic Rep.IraqIrelandIsraelItalyJamaicaJapanJordanKazakhstanKenyaKiribatiKorea, Dem. People’s Rep.Korea, Rep.KosovoKuwaitKyrgyz RepublicLao PDRLate-demographic dividendLatin America & Caribbean Latin America & Caribbean (excluding high income)Latin America & the Caribbean (IDA & IBRD countries)LatviaLeast developed countries: UN classificationLebanonLesothoLiberiaLibyaLithuaniaLow & middle incomeLow incomeLower middle incomeLuxembourgMacao SAR, ChinaMacedonia, FYRMadagascarMalawiMalaysiaMaldivesMaliMaltaMauritaniaMauritiusMexicoMicronesia, Fed. Sts.Middle East & North AfricaMiddle East & North Africa (excluding high income)Middle East & North Africa (IDA & IBRD countries)Middle incomeMoldovaMongoliaMontenegroMoroccoMozambiqueMyanmarNamibiaNepalNetherlandsNew CaledoniaNew ZealandNicaraguaNigerNigeriaNorth AmericaNorwayOECD membersOmanOther small statesPacific island small statesPakistanPanamaPapua New GuineaParaguayPeruPhilippinesPolandPortugalPost-demographic dividendPre-demographic dividendPuerto RicoQatarRomaniaRussian FederationRwandaSamoaSao Tome and PrincipeSaudi ArabiaSenegalSerbiaSeychellesSierra LeoneSingaporeSlovak RepublicSloveniaSmall statesSolomon IslandsSomaliaSouth AfricaSouth AsiaSouth Asia (IDA & IBRD)South SudanSpainSri LankaSt. LuciaSt. Vincent and the GrenadinesSub-Saharan Africa Sub-Saharan Africa (excluding high income)Sub-Saharan Africa (IDA & IBRD countries)SudanSurinameSwazilandSwedenSwitzerlandSyrian Arab RepublicTajikistanTanzaniaThailandTimor-LesteTogoTongaTrinidad and TobagoTunisiaTurkeyTurkmenistanUgandaUkraineUnited Arab EmiratesUnited KingdomUnited StatesUpper middle incomeUruguayUzbekistanVanuatuVenezuela, RBVietnamVirgin Islands (U.S.)West Bank and GazaWorldYemen, Rep.ZambiaZimbabwe Timeline:
This timeline shows a graph from 1961 to 2016 of Japan. No data until 1960. Number of actual observations by date: 56.
Source name:
World Development Indicators
Source organization:
World Bank staff estimates based on age distributions of United Nations Population Division's World Population Prospects.
Categories, topics:
Health
Last updated:
apr 23, 2017
Indicators value changes by year
Maximum:
26.342
jan 1, 2016
At the date of observation
Value
Absolute change
Change from previous value
jan 1, 1961
5.726
+5.726
0.0%
jan 1, 1962
5.836
+0.11
1.93%
jan 1, 1963
5.946
+0.11
1.88%
jan 1, 1964
6.056
+0.11
1.85%
jan 1, 1965
6.165
+0.109
1.81%
jan 1, 1966
6.274
+0.109
1.77%
jan 1, 1967
6.426
+0.152
2.42%
jan 1, 1968
6.583
+0.156
2.43%
jan 1, 1969
6.739
+0.156
2.37%
jan 1, 1970
6.889
+0.15
2.23%
jan 1, 1971
7.032
+0.143
2.08%
jan 1, 1972
7.206
+0.174
2.47%
jan 1, 1973
7.367
+0.161
2.23%
jan 1, 1974
7.524
+0.157
2.13%
jan 1, 1975
7.692
+0.168
2.24%
jan 1, 1976
7.882
+0.19
2.47%
jan 1, 1977
8.095
+0.213
2.71%
jan 1, 1978
8.337
+0.241
2.98%
jan 1, 1979
8.59
+0.254
3.04%
jan 1, 1980
8.831
+0.24
2.8%
jan 1, 1981
9.046
+0.215
2.44%
jan 1, 1982
9.293
+0.248
2.74%
jan 1, 1983
9.509
+0.215
2.32%
jan 1, 1984
9.713
+0.204
2.15%
jan 1, 1985
9.937
+0.224
2.31%
jan 1, 1986
10.199
+0.262
2.63%
jan 1, 1987
10.478
+0.28
2.74%
jan 1, 1988
10.791
+0.313
2.99%
jan 1, 1989
11.141
+0.35
3.24%
jan 1, 1990
11.527
+0.386
3.46%
jan 1, 1991
11.948
+0.422
3.66%
jan 1, 1992
12.388
+0.44
3.68%
jan 1, 1993
12.859
+0.471
3.8%
jan 1, 1994
13.354
+0.495
3.85%
jan 1, 1995
13.867
+0.513
3.84%
jan 1, 1996
14.393
+0.526
3.79%
jan 1, 1997
14.941
+0.547
3.8%
jan 1, 1998
15.498
+0.557
3.73%
jan 1, 1999
16.061
+0.563
3.63%
jan 1, 2000
16.622
+0.562
3.5%
jan 1, 2001
17.18
+0.558
3.36%
jan 1, 2002
17.703
+0.523
3.04%
jan 1, 2003
18.226
+0.523
2.96%
jan 1, 2004
18.755
+0.528
2.9%
jan 1, 2005
19.294
+0.539
2.87%
jan 1, 2006
19.847
+0.553
2.87%
jan 1, 2007
20.394
+0.547
2.76%
jan 1, 2008
20.958
+0.564
2.77%
jan 1, 2009
21.557
+0.599
2.86%
jan 1, 2010
22.215
+0.658
3.05%
jan 1, 2011
22.942
+0.727
3.27%
jan 1, 2012
23.587
+0.645
2.81%
jan 1, 2013
24.287
+0.699
2.97%
jan 1, 2014
25.009
+0.723
2.98%
jan 1, 2015
25.705
+0.696
2.78%
jan 1, 2016
26.342
+0.637
2.48%
Ranking of countries by current statistics by years


Comments: