29
/
en
AIzaSyAYiBZKx7MnpbEhh9jyipgxe19OcubqV5w
April 1, 2024
216941
Pakistan
PAK
true
2
1
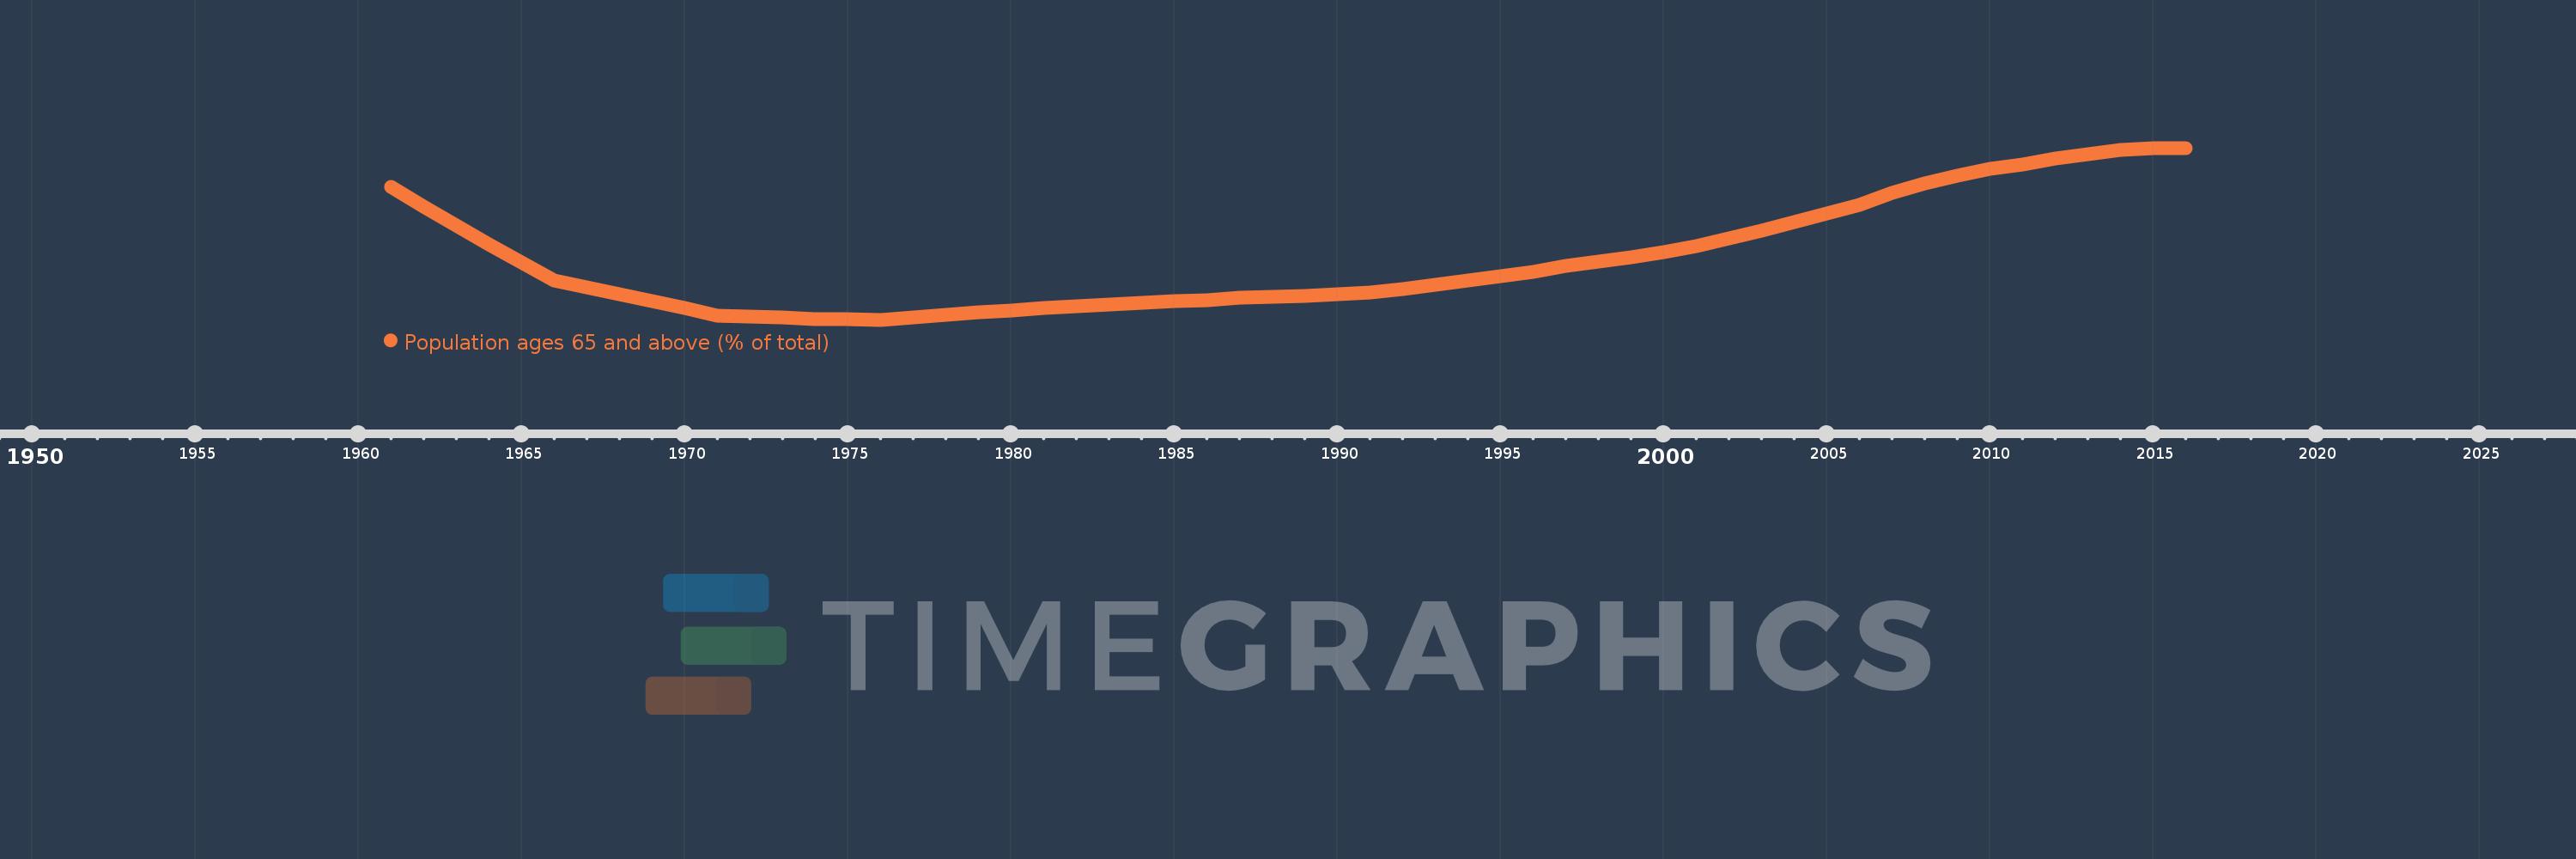
Population ages 65 and above (% of total)
2016,2015,2014,2013,2012,2011,2010,2009,2008,2007,2006,2005,2004,2003,2002,2001,2000,1999,1998,1997,1996,1995,1994,1993,1992,1991,1990,1989,1988,1987,1986,1985,1984,1983,1982,1981,1980,1979,1978,1977,1976,1975,1974,1973,1972,1971,1970,1969,1968,1967,1966,1965,1964,1963,1962,1961
This statistics in other country:
AfghanistanAlbaniaAlgeriaAngolaAntigua and BarbudaArab WorldArgentinaArmeniaArubaAustraliaAustriaAzerbaijanBahamas, TheBahrainBangladeshBarbadosBelarusBelgiumBelizeBeninBhutanBoliviaBosnia and HerzegovinaBotswanaBrazilBrunei DarussalamBulgariaBurkina FasoBurundiCabo VerdeCambodiaCameroonCanadaCaribbean small statesCentral African RepublicCentral Europe and the BalticsChadChannel IslandsChileChinaColombiaComorosCongo, Dem. Rep.Congo, Rep.Costa RicaCote d'IvoireCroatiaCubaCuracaoCyprusCzech RepublicDenmarkDjiboutiDominican RepublicEarly-demographic dividendEast Asia & PacificEast Asia & Pacific (excluding high income)East Asia & Pacific (IDA & IBRD countries)EcuadorEgypt, Arab Rep.El SalvadorEquatorial GuineaEritreaEstoniaEthiopiaEuro areaEurope & Central AsiaEurope & Central Asia (excluding high income)Europe & Central Asia (IDA & IBRD countries)European UnionFijiFinlandFragile and conflict affected situationsFranceFrench PolynesiaGabonGambia, TheGeorgiaGermanyGhanaGreeceGrenadaGuamGuatemalaGuineaGuinea-BissauGuyanaHaitiHeavily indebted poor countries (HIPC)High incomeHondurasHong Kong SAR, ChinaHungaryIBRD onlyIcelandIDA & IBRD totalIDA blendIDA onlyIDA totalIndiaIndonesiaIran, Islamic Rep.IraqIrelandIsraelItalyJamaicaJapanJordanKazakhstanKenyaKiribatiKorea, Dem. People’s Rep.Korea, Rep.KosovoKuwaitKyrgyz RepublicLao PDRLate-demographic dividendLatin America & Caribbean Latin America & Caribbean (excluding high income)Latin America & the Caribbean (IDA & IBRD countries)LatviaLeast developed countries: UN classificationLebanonLesothoLiberiaLibyaLithuaniaLow & middle incomeLow incomeLower middle incomeLuxembourgMacao SAR, ChinaMacedonia, FYRMadagascarMalawiMalaysiaMaldivesMaliMaltaMauritaniaMauritiusMexicoMicronesia, Fed. Sts.Middle East & North AfricaMiddle East & North Africa (excluding high income)Middle East & North Africa (IDA & IBRD countries)Middle incomeMoldovaMongoliaMontenegroMoroccoMozambiqueMyanmarNamibiaNepalNetherlandsNew CaledoniaNew ZealandNicaraguaNigerNigeriaNorth AmericaNorwayOECD membersOmanOther small statesPacific island small statesPakistanPanamaPapua New GuineaParaguayPeruPhilippinesPolandPortugalPost-demographic dividendPre-demographic dividendPuerto RicoQatarRomaniaRussian FederationRwandaSamoaSao Tome and PrincipeSaudi ArabiaSenegalSerbiaSeychellesSierra LeoneSingaporeSlovak RepublicSloveniaSmall statesSolomon IslandsSomaliaSouth AfricaSouth AsiaSouth Asia (IDA & IBRD)South SudanSpainSri LankaSt. LuciaSt. Vincent and the GrenadinesSub-Saharan Africa Sub-Saharan Africa (excluding high income)Sub-Saharan Africa (IDA & IBRD countries)SudanSurinameSwazilandSwedenSwitzerlandSyrian Arab RepublicTajikistanTanzaniaThailandTimor-LesteTogoTongaTrinidad and TobagoTunisiaTurkeyTurkmenistanUgandaUkraineUnited Arab EmiratesUnited KingdomUnited StatesUpper middle incomeUruguayUzbekistanVanuatuVenezuela, RBVietnamVirgin Islands (U.S.)West Bank and GazaWorldYemen, Rep.ZambiaZimbabwe Timeline:
This timeline shows a graph from 1961 to 2016 of Pakistan. No data until 1960. Number of actual observations by date: 56.
Source name:
World Development Indicators
Source organization:
World Bank staff estimates based on age distributions of United Nations Population Division's World Population Prospects.
Categories, topics:
Health
Last updated:
apr 23, 2017
Indicators value changes by year
At the date of observation
Value
Absolute change
Change from previous value
jan 1, 1961
4.334
+4.334
0.0%
jan 1, 1962
4.254
-0.08
-1.85%
jan 1, 1963
4.178
-0.077
-1.8%
jan 1, 1964
4.103
-0.074
-1.78%
jan 1, 1965
4.03
-0.074
-1.79%
jan 1, 1966
3.957
-0.073
-1.81%
jan 1, 1967
3.93
-0.027
-0.69%
jan 1, 1968
3.901
-0.028
-0.72%
jan 1, 1969
3.873
-0.029
-0.74%
jan 1, 1970
3.844
-0.029
-0.75%
jan 1, 1971
3.815
-0.029
-0.76%
jan 1, 1972
3.811
-0.003
-0.08%
jan 1, 1973
3.806
-0.005
-0.13%
jan 1, 1974
3.802
-0.005
-0.12%
jan 1, 1975
3.799
-0.003
-0.08%
jan 1, 1976
3.798
-0.001
-0.02%
jan 1, 1977
3.808
+0.01
0.26%
jan 1, 1978
3.817
+0.009
0.25%
jan 1, 1979
3.827
+0.009
0.24%
jan 1, 1980
3.836
+0.009
0.24%
jan 1, 1981
3.845
+0.009
0.23%
jan 1, 1982
3.853
+0.008
0.21%
jan 1, 1983
3.86
+0.007
0.18%
jan 1, 1984
3.866
+0.006
0.16%
jan 1, 1985
3.872
+0.006
0.15%
jan 1, 1986
3.877
+0.006
0.15%
jan 1, 1987
3.887
+0.01
0.25%
jan 1, 1988
3.892
+0.005
0.13%
jan 1, 1989
3.895
+0.003
0.08%
jan 1, 1990
3.9
+0.005
0.12%
jan 1, 1991
3.908
+0.008
0.21%
jan 1, 1992
3.922
+0.014
0.36%
jan 1, 1993
3.938
+0.016
0.42%
jan 1, 1994
3.956
+0.018
0.46%
jan 1, 1995
3.974
+0.018
0.45%
jan 1, 1996
3.991
+0.017
0.43%
jan 1, 1997
4.015
+0.024
0.59%
jan 1, 1998
4.034
+0.019
0.47%
jan 1, 1999
4.051
+0.017
0.43%
jan 1, 2000
4.071
+0.02
0.49%
jan 1, 2001
4.096
+0.025
0.61%
jan 1, 2002
4.127
+0.031
0.76%
jan 1, 2003
4.159
+0.032
0.78%
jan 1, 2004
4.193
+0.034
0.81%
jan 1, 2005
4.227
+0.034
0.82%
jan 1, 2006
4.262
+0.035
0.82%
jan 1, 2007
4.309
+0.047
1.1%
jan 1, 2008
4.348
+0.039
0.91%
jan 1, 2009
4.38
+0.032
0.74%
jan 1, 2010
4.406
+0.026
0.59%
jan 1, 2011
4.426
+0.02
0.46%
jan 1, 2012
4.448
+0.021
0.48%
jan 1, 2013
4.467
+0.019
0.44%
jan 1, 2014
4.483
+0.015
0.35%
jan 1, 2015
4.491
+0.008
0.19%
jan 1, 2016
4.492
+0.001
0.03%
Ranking of countries by current statistics by years


Comments: