29
/
en
AIzaSyAYiBZKx7MnpbEhh9jyipgxe19OcubqV5w
April 1, 2024
28523
East Asia & Pacific (excluding high income)
EAP
false
2
1
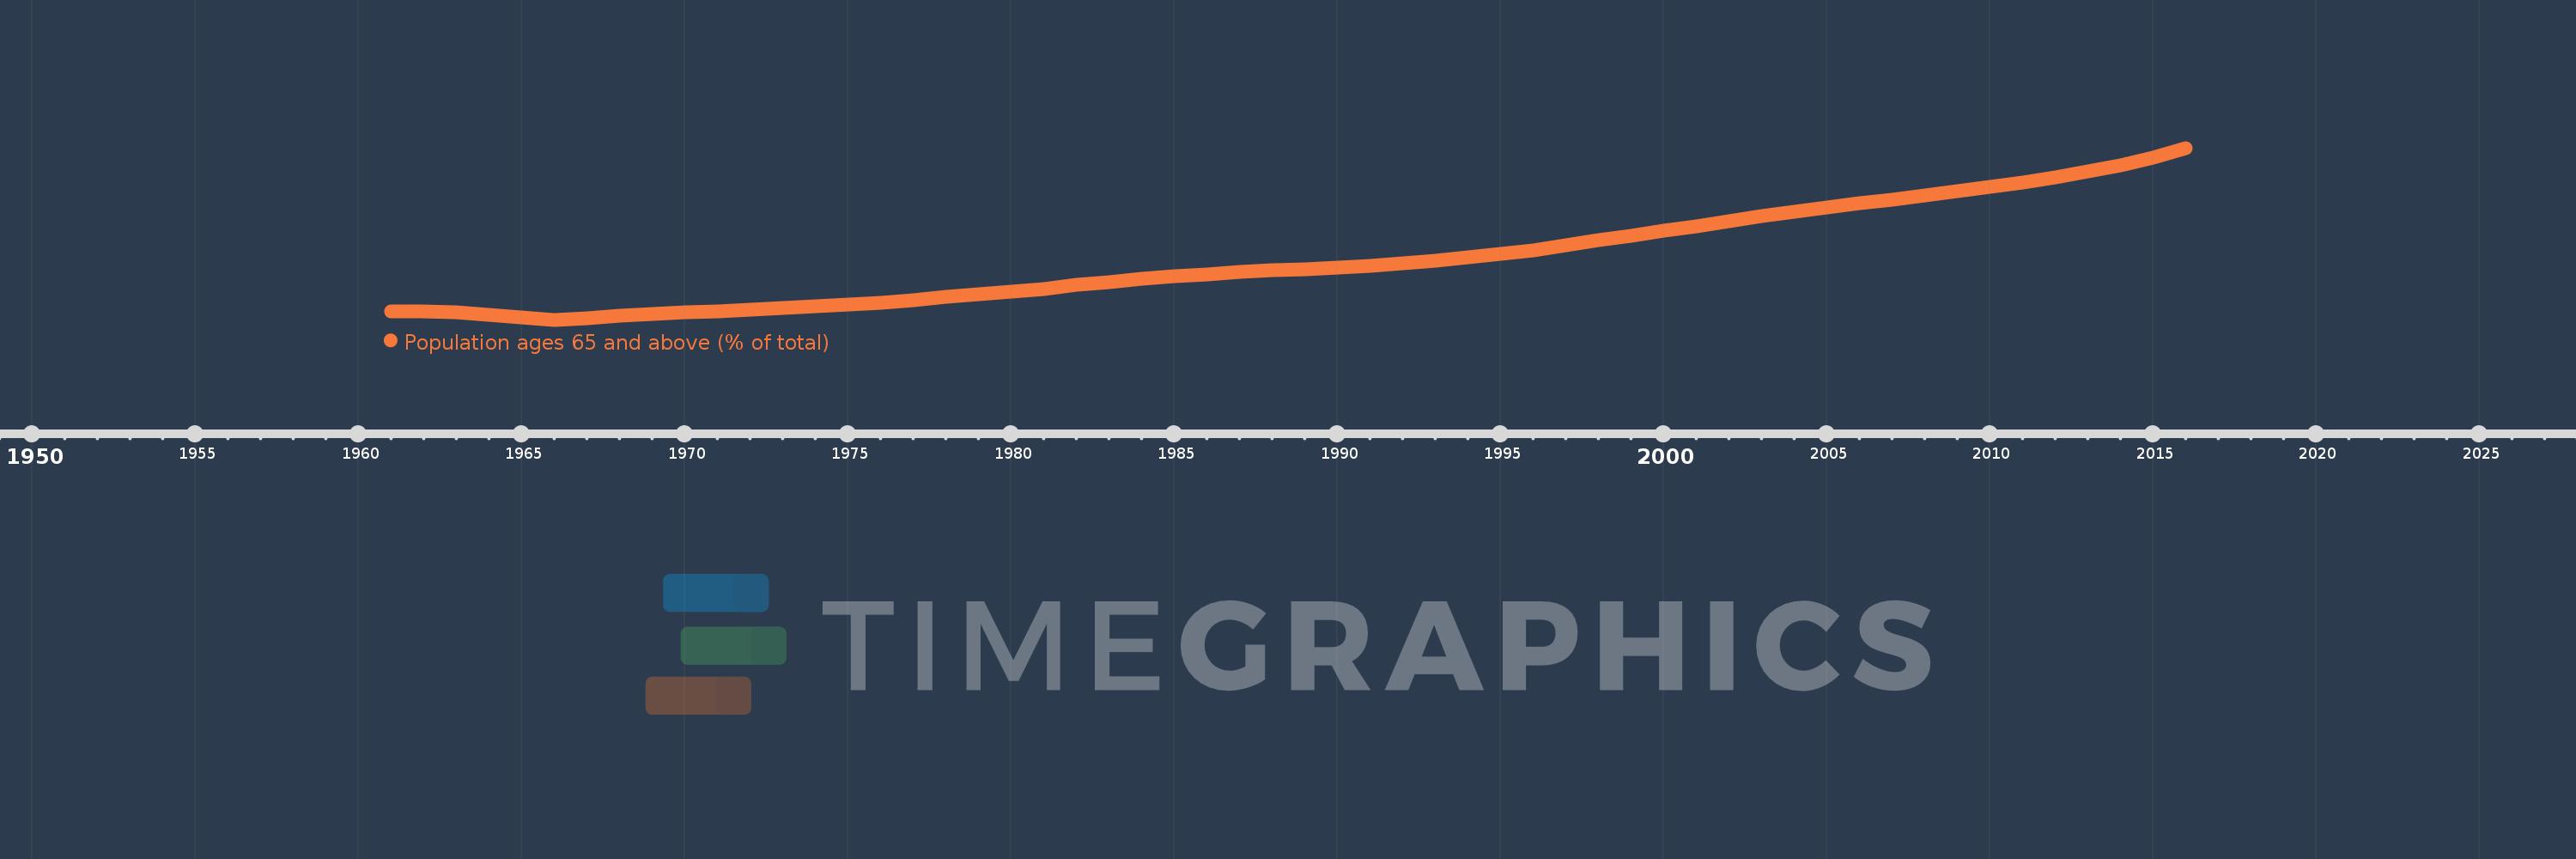
Population ages 65 and above (% of total)
2016,2015,2014,2013,2012,2011,2010,2009,2008,2007,2006,2005,2004,2003,2002,2001,2000,1999,1998,1997,1996,1995,1994,1993,1992,1991,1990,1989,1988,1987,1986,1985,1984,1983,1982,1981,1980,1979,1978,1977,1976,1975,1974,1973,1972,1971,1970,1969,1968,1967,1966,1965,1964,1963,1962,1961
This statistics in other country:
AfghanistanAlbaniaAlgeriaAngolaAntigua and BarbudaArab WorldArgentinaArmeniaArubaAustraliaAustriaAzerbaijanBahamas, TheBahrainBangladeshBarbadosBelarusBelgiumBelizeBeninBhutanBoliviaBosnia and HerzegovinaBotswanaBrazilBrunei DarussalamBulgariaBurkina FasoBurundiCabo VerdeCambodiaCameroonCanadaCaribbean small statesCentral African RepublicCentral Europe and the BalticsChadChannel IslandsChileChinaColombiaComorosCongo, Dem. Rep.Congo, Rep.Costa RicaCote d'IvoireCroatiaCubaCuracaoCyprusCzech RepublicDenmarkDjiboutiDominican RepublicEarly-demographic dividendEast Asia & PacificEast Asia & Pacific (excluding high income)East Asia & Pacific (IDA & IBRD countries)EcuadorEgypt, Arab Rep.El SalvadorEquatorial GuineaEritreaEstoniaEthiopiaEuro areaEurope & Central AsiaEurope & Central Asia (excluding high income)Europe & Central Asia (IDA & IBRD countries)European UnionFijiFinlandFragile and conflict affected situationsFranceFrench PolynesiaGabonGambia, TheGeorgiaGermanyGhanaGreeceGrenadaGuamGuatemalaGuineaGuinea-BissauGuyanaHaitiHeavily indebted poor countries (HIPC)High incomeHondurasHong Kong SAR, ChinaHungaryIBRD onlyIcelandIDA & IBRD totalIDA blendIDA onlyIDA totalIndiaIndonesiaIran, Islamic Rep.IraqIrelandIsraelItalyJamaicaJapanJordanKazakhstanKenyaKiribatiKorea, Dem. People’s Rep.Korea, Rep.KosovoKuwaitKyrgyz RepublicLao PDRLate-demographic dividendLatin America & Caribbean Latin America & Caribbean (excluding high income)Latin America & the Caribbean (IDA & IBRD countries)LatviaLeast developed countries: UN classificationLebanonLesothoLiberiaLibyaLithuaniaLow & middle incomeLow incomeLower middle incomeLuxembourgMacao SAR, ChinaMacedonia, FYRMadagascarMalawiMalaysiaMaldivesMaliMaltaMauritaniaMauritiusMexicoMicronesia, Fed. Sts.Middle East & North AfricaMiddle East & North Africa (excluding high income)Middle East & North Africa (IDA & IBRD countries)Middle incomeMoldovaMongoliaMontenegroMoroccoMozambiqueMyanmarNamibiaNepalNetherlandsNew CaledoniaNew ZealandNicaraguaNigerNigeriaNorth AmericaNorwayOECD membersOmanOther small statesPacific island small statesPakistanPanamaPapua New GuineaParaguayPeruPhilippinesPolandPortugalPost-demographic dividendPre-demographic dividendPuerto RicoQatarRomaniaRussian FederationRwandaSamoaSao Tome and PrincipeSaudi ArabiaSenegalSerbiaSeychellesSierra LeoneSingaporeSlovak RepublicSloveniaSmall statesSolomon IslandsSomaliaSouth AfricaSouth AsiaSouth Asia (IDA & IBRD)South SudanSpainSri LankaSt. LuciaSt. Vincent and the GrenadinesSub-Saharan Africa Sub-Saharan Africa (excluding high income)Sub-Saharan Africa (IDA & IBRD countries)SudanSurinameSwazilandSwedenSwitzerlandSyrian Arab RepublicTajikistanTanzaniaThailandTimor-LesteTogoTongaTrinidad and TobagoTunisiaTurkeyTurkmenistanUgandaUkraineUnited Arab EmiratesUnited KingdomUnited StatesUpper middle incomeUruguayUzbekistanVanuatuVenezuela, RBVietnamVirgin Islands (U.S.)West Bank and GazaWorldYemen, Rep.ZambiaZimbabwe Timeline:
This timeline shows a graph from 1961 to 2016 of East Asia & Pacific (excluding high income). No data until 1960. Number of actual observations by date: 56.
Source name:
World Development Indicators
Source organization:
World Bank staff estimates based on age distributions of United Nations Population Division's World Population Prospects.
Categories, topics:
Health
Last updated:
apr 23, 2017
Indicators value changes by year
At the date of observation
Value
Absolute change
Change from previous value
jan 1, 1961
3.632
+3.632
0.0%
jan 1, 1962
3.644
+0.013
0.35%
jan 1, 1963
3.612
-0.032
-0.89%
jan 1, 1964
3.55
-0.062
-1.72%
jan 1, 1965
3.478
-0.073
-2.04%
jan 1, 1966
3.402
-0.076
-2.17%
jan 1, 1967
3.456
+0.054
1.59%
jan 1, 1968
3.512
+0.056
1.62%
jan 1, 1969
3.565
+0.053
1.5%
jan 1, 1970
3.609
+0.044
1.23%
jan 1, 1971
3.643
+0.035
0.96%
jan 1, 1972
3.699
+0.056
1.53%
jan 1, 1973
3.751
+0.052
1.41%
jan 1, 1974
3.799
+0.048
1.29%
jan 1, 1975
3.846
+0.046
1.22%
jan 1, 1976
3.891
+0.046
1.19%
jan 1, 1977
3.978
+0.086
2.21%
jan 1, 1978
4.061
+0.083
2.09%
jan 1, 1979
4.142
+0.081
2.0%
jan 1, 1980
4.222
+0.08
1.94%
jan 1, 1981
4.301
+0.079
1.86%
jan 1, 1982
4.406
+0.106
2.45%
jan 1, 1983
4.502
+0.095
2.17%
jan 1, 1984
4.588
+0.086
1.9%
jan 1, 1985
4.662
+0.074
1.62%
jan 1, 1986
4.725
+0.063
1.34%
jan 1, 1987
4.784
+0.06
1.26%
jan 1, 1988
4.831
+0.047
0.98%
jan 1, 1989
4.872
+0.041
0.84%
jan 1, 1990
4.917
+0.045
0.93%
jan 1, 1991
4.974
+0.058
1.17%
jan 1, 1992
5.041
+0.066
1.34%
jan 1, 1993
5.124
+0.083
1.65%
jan 1, 1994
5.219
+0.095
1.86%
jan 1, 1995
5.32
+0.101
1.93%
jan 1, 1996
5.425
+0.105
1.97%
jan 1, 1997
5.572
+0.147
2.71%
jan 1, 1998
5.711
+0.139
2.49%
jan 1, 1999
5.845
+0.134
2.35%
jan 1, 2000
5.979
+0.134
2.3%
jan 1, 2001
6.117
+0.137
2.29%
jan 1, 2002
6.265
+0.148
2.42%
jan 1, 2003
6.406
+0.141
2.25%
jan 1, 2004
6.54
+0.134
2.09%
jan 1, 2005
6.663
+0.123
1.88%
jan 1, 2006
6.776
+0.113
1.69%
jan 1, 2007
6.896
+0.121
1.78%
jan 1, 2008
7.012
+0.116
1.69%
jan 1, 2009
7.129
+0.116
1.66%
jan 1, 2010
7.252
+0.123
1.72%
jan 1, 2011
7.388
+0.136
1.87%
jan 1, 2012
7.544
+0.156
2.12%
jan 1, 2013
7.705
+0.161
2.13%
jan 1, 2014
7.885
+0.18
2.33%
jan 1, 2015
8.108
+0.224
2.84%
jan 1, 2016
8.389
+0.28
3.45%
Ranking of countries by current statistics by years


Comments: