29
/
en
AIzaSyAYiBZKx7MnpbEhh9jyipgxe19OcubqV5w
April 1, 2024
181517
Lithuania
LTU
true
2
1
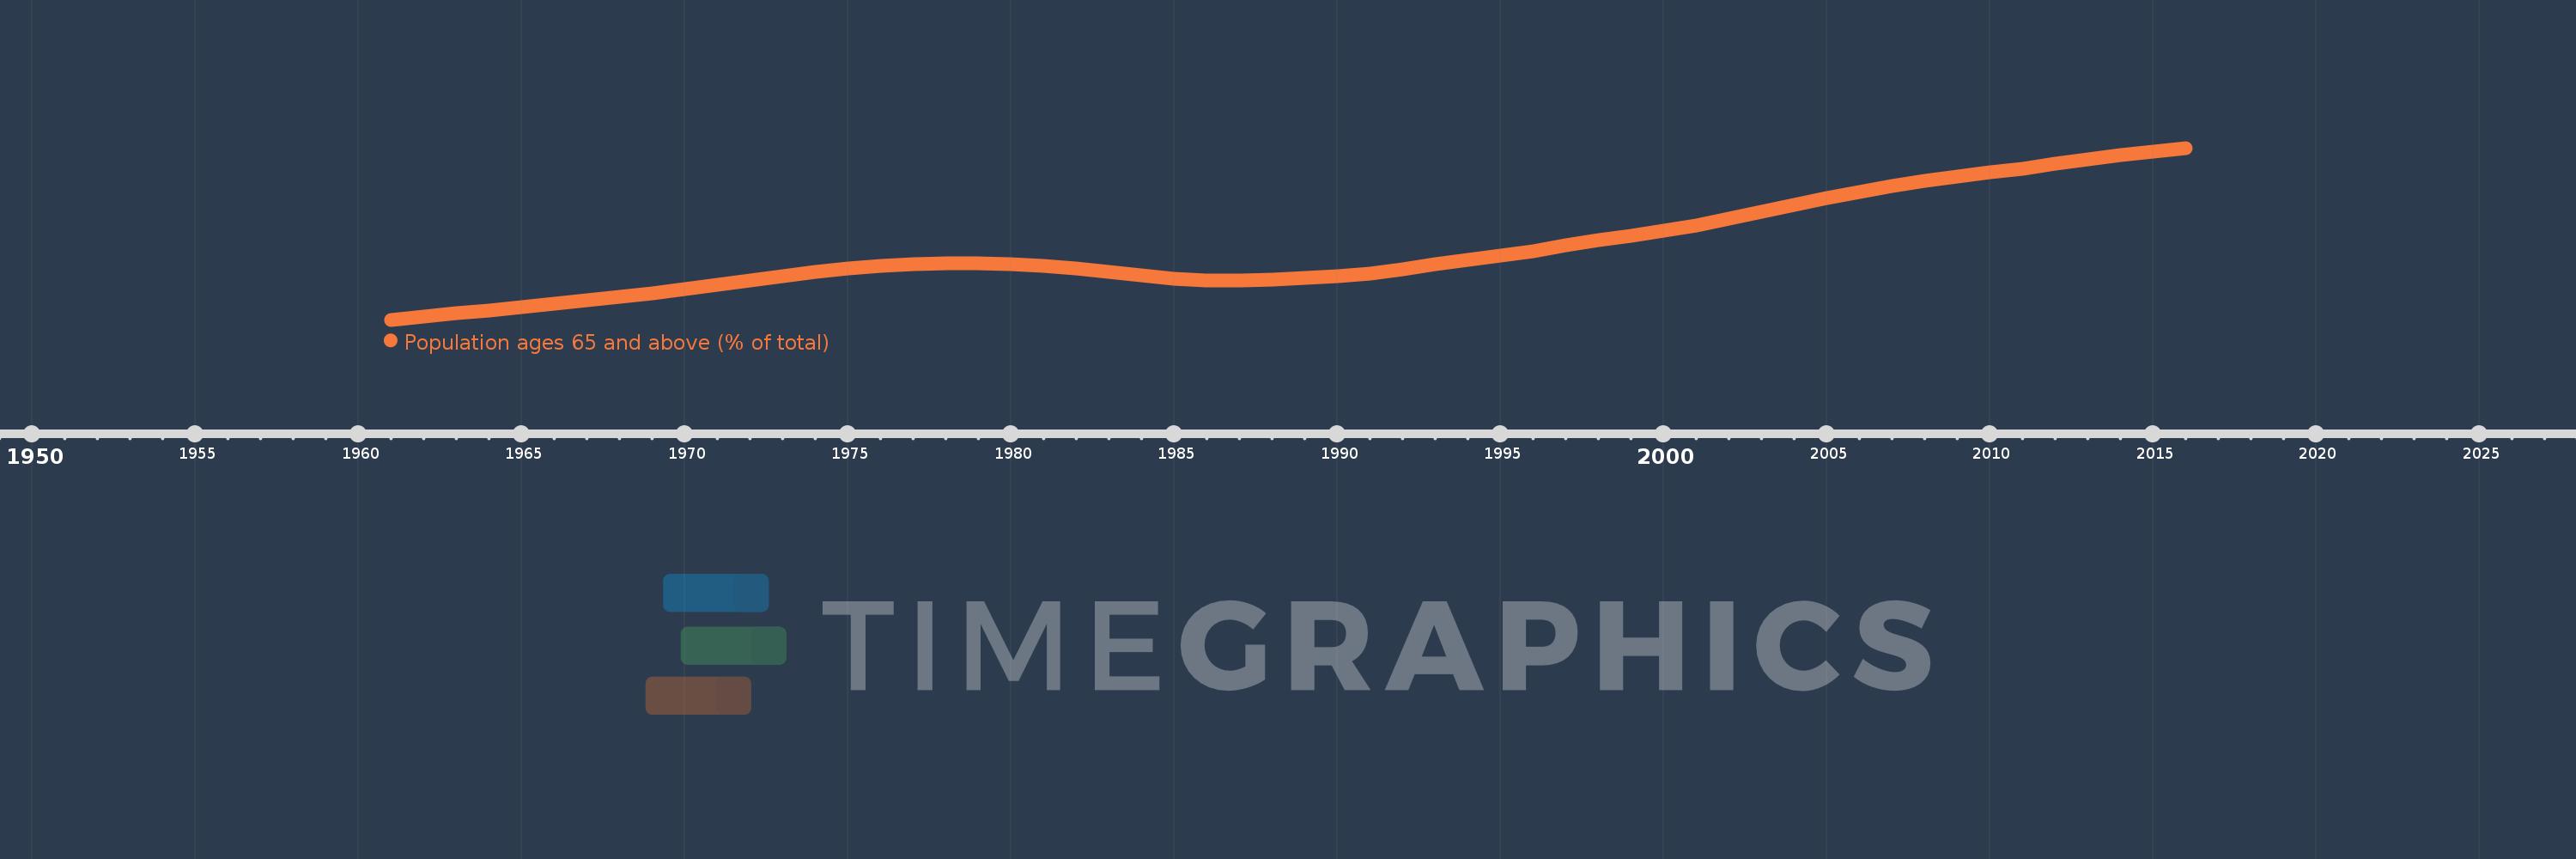
Population ages 65 and above (% of total)
2016,2015,2014,2013,2012,2011,2010,2009,2008,2007,2006,2005,2004,2003,2002,2001,2000,1999,1998,1997,1996,1995,1994,1993,1992,1991,1990,1989,1988,1987,1986,1985,1984,1983,1982,1981,1980,1979,1978,1977,1976,1975,1974,1973,1972,1971,1970,1969,1968,1967,1966,1965,1964,1963,1962,1961
This statistics in other country:
AfghanistanAlbaniaAlgeriaAngolaAntigua and BarbudaArab WorldArgentinaArmeniaArubaAustraliaAustriaAzerbaijanBahamas, TheBahrainBangladeshBarbadosBelarusBelgiumBelizeBeninBhutanBoliviaBosnia and HerzegovinaBotswanaBrazilBrunei DarussalamBulgariaBurkina FasoBurundiCabo VerdeCambodiaCameroonCanadaCaribbean small statesCentral African RepublicCentral Europe and the BalticsChadChannel IslandsChileChinaColombiaComorosCongo, Dem. Rep.Congo, Rep.Costa RicaCote d'IvoireCroatiaCubaCuracaoCyprusCzech RepublicDenmarkDjiboutiDominican RepublicEarly-demographic dividendEast Asia & PacificEast Asia & Pacific (excluding high income)East Asia & Pacific (IDA & IBRD countries)EcuadorEgypt, Arab Rep.El SalvadorEquatorial GuineaEritreaEstoniaEthiopiaEuro areaEurope & Central AsiaEurope & Central Asia (excluding high income)Europe & Central Asia (IDA & IBRD countries)European UnionFijiFinlandFragile and conflict affected situationsFranceFrench PolynesiaGabonGambia, TheGeorgiaGermanyGhanaGreeceGrenadaGuamGuatemalaGuineaGuinea-BissauGuyanaHaitiHeavily indebted poor countries (HIPC)High incomeHondurasHong Kong SAR, ChinaHungaryIBRD onlyIcelandIDA & IBRD totalIDA blendIDA onlyIDA totalIndiaIndonesiaIran, Islamic Rep.IraqIrelandIsraelItalyJamaicaJapanJordanKazakhstanKenyaKiribatiKorea, Dem. People’s Rep.Korea, Rep.KosovoKuwaitKyrgyz RepublicLao PDRLate-demographic dividendLatin America & Caribbean Latin America & Caribbean (excluding high income)Latin America & the Caribbean (IDA & IBRD countries)LatviaLeast developed countries: UN classificationLebanonLesothoLiberiaLibyaLithuaniaLow & middle incomeLow incomeLower middle incomeLuxembourgMacao SAR, ChinaMacedonia, FYRMadagascarMalawiMalaysiaMaldivesMaliMaltaMauritaniaMauritiusMexicoMicronesia, Fed. Sts.Middle East & North AfricaMiddle East & North Africa (excluding high income)Middle East & North Africa (IDA & IBRD countries)Middle incomeMoldovaMongoliaMontenegroMoroccoMozambiqueMyanmarNamibiaNepalNetherlandsNew CaledoniaNew ZealandNicaraguaNigerNigeriaNorth AmericaNorwayOECD membersOmanOther small statesPacific island small statesPakistanPanamaPapua New GuineaParaguayPeruPhilippinesPolandPortugalPost-demographic dividendPre-demographic dividendPuerto RicoQatarRomaniaRussian FederationRwandaSamoaSao Tome and PrincipeSaudi ArabiaSenegalSerbiaSeychellesSierra LeoneSingaporeSlovak RepublicSloveniaSmall statesSolomon IslandsSomaliaSouth AfricaSouth AsiaSouth Asia (IDA & IBRD)South SudanSpainSri LankaSt. LuciaSt. Vincent and the GrenadinesSub-Saharan Africa Sub-Saharan Africa (excluding high income)Sub-Saharan Africa (IDA & IBRD countries)SudanSurinameSwazilandSwedenSwitzerlandSyrian Arab RepublicTajikistanTanzaniaThailandTimor-LesteTogoTongaTrinidad and TobagoTunisiaTurkeyTurkmenistanUgandaUkraineUnited Arab EmiratesUnited KingdomUnited StatesUpper middle incomeUruguayUzbekistanVanuatuVenezuela, RBVietnamVirgin Islands (U.S.)West Bank and GazaWorldYemen, Rep.ZambiaZimbabwe Timeline:
This timeline shows a graph from 1961 to 2016 of Lithuania. No data until 1960. Number of actual observations by date: 56.
Source name:
World Development Indicators
Source organization:
World Bank staff estimates based on age distributions of United Nations Population Division's World Population Prospects.
Categories, topics:
Health
Last updated:
apr 23, 2017
Indicators value changes by year
Maximum:
18.848
jan 1, 2016
At the date of observation
Value
Absolute change
Change from previous value
jan 1, 1961
7.928
+7.928
0.0%
jan 1, 1962
8.127
+0.199
2.51%
jan 1, 1963
8.328
+0.202
2.48%
jan 1, 1964
8.531
+0.203
2.43%
jan 1, 1965
8.739
+0.208
2.43%
jan 1, 1966
8.957
+0.218
2.5%
jan 1, 1967
9.179
+0.222
2.48%
jan 1, 1968
9.4
+0.221
2.41%
jan 1, 1969
9.628
+0.228
2.42%
jan 1, 1970
9.875
+0.247
2.57%
jan 1, 1971
10.147
+0.272
2.76%
jan 1, 1972
10.439
+0.291
2.87%
jan 1, 1973
10.723
+0.284
2.72%
jan 1, 1974
10.985
+0.263
2.45%
jan 1, 1975
11.207
+0.222
2.02%
jan 1, 1976
11.377
+0.17
1.52%
jan 1, 1977
11.453
+0.077
0.67%
jan 1, 1978
11.502
+0.049
0.42%
jan 1, 1979
11.512
+0.01
0.09%
jan 1, 1980
11.463
-0.049
-0.42%
jan 1, 1981
11.35
-0.113
-0.99%
jan 1, 1982
11.201
-0.149
-1.31%
jan 1, 1983
10.979
-0.222
-1.98%
jan 1, 1984
10.733
-0.246
-2.24%
jan 1, 1985
10.53
-0.202
-1.89%
jan 1, 1986
10.41
-0.121
-1.15%
jan 1, 1987
10.398
-0.011
-0.11%
jan 1, 1988
10.457
+0.058
0.56%
jan 1, 1989
10.568
+0.112
1.07%
jan 1, 1990
10.711
+0.143
1.35%
jan 1, 1991
10.874
+0.162
1.52%
jan 1, 1992
11.149
+0.276
2.54%
jan 1, 1993
11.44
+0.29
2.6%
jan 1, 1994
11.734
+0.294
2.57%
jan 1, 1995
12.018
+0.285
2.43%
jan 1, 1996
12.285
+0.266
2.22%
jan 1, 1997
12.638
+0.353
2.88%
jan 1, 1998
12.969
+0.331
2.62%
jan 1, 1999
13.286
+0.317
2.45%
jan 1, 2000
13.602
+0.316
2.38%
jan 1, 2001
13.92
+0.318
2.34%
jan 1, 2002
14.352
+0.432
3.11%
jan 1, 2003
14.792
+0.44
3.06%
jan 1, 2004
15.232
+0.44
2.98%
jan 1, 2005
15.658
+0.426
2.8%
jan 1, 2006
16.059
+0.401
2.56%
jan 1, 2007
16.424
+0.364
2.27%
jan 1, 2008
16.752
+0.328
2.0%
jan 1, 2009
17.037
+0.286
1.7%
jan 1, 2010
17.283
+0.246
1.44%
jan 1, 2011
17.496
+0.213
1.23%
jan 1, 2012
17.845
+0.349
2.0%
jan 1, 2013
18.143
+0.298
1.67%
jan 1, 2014
18.385
+0.242
1.34%
jan 1, 2015
18.605
+0.22
1.2%
jan 1, 2016
18.848
+0.243
1.31%
Ranking of countries by current statistics by years


Comments: