29
/
en
AIzaSyAYiBZKx7MnpbEhh9jyipgxe19OcubqV5w
April 1, 2024
251202
St. Lucia
LCA
true
2
1
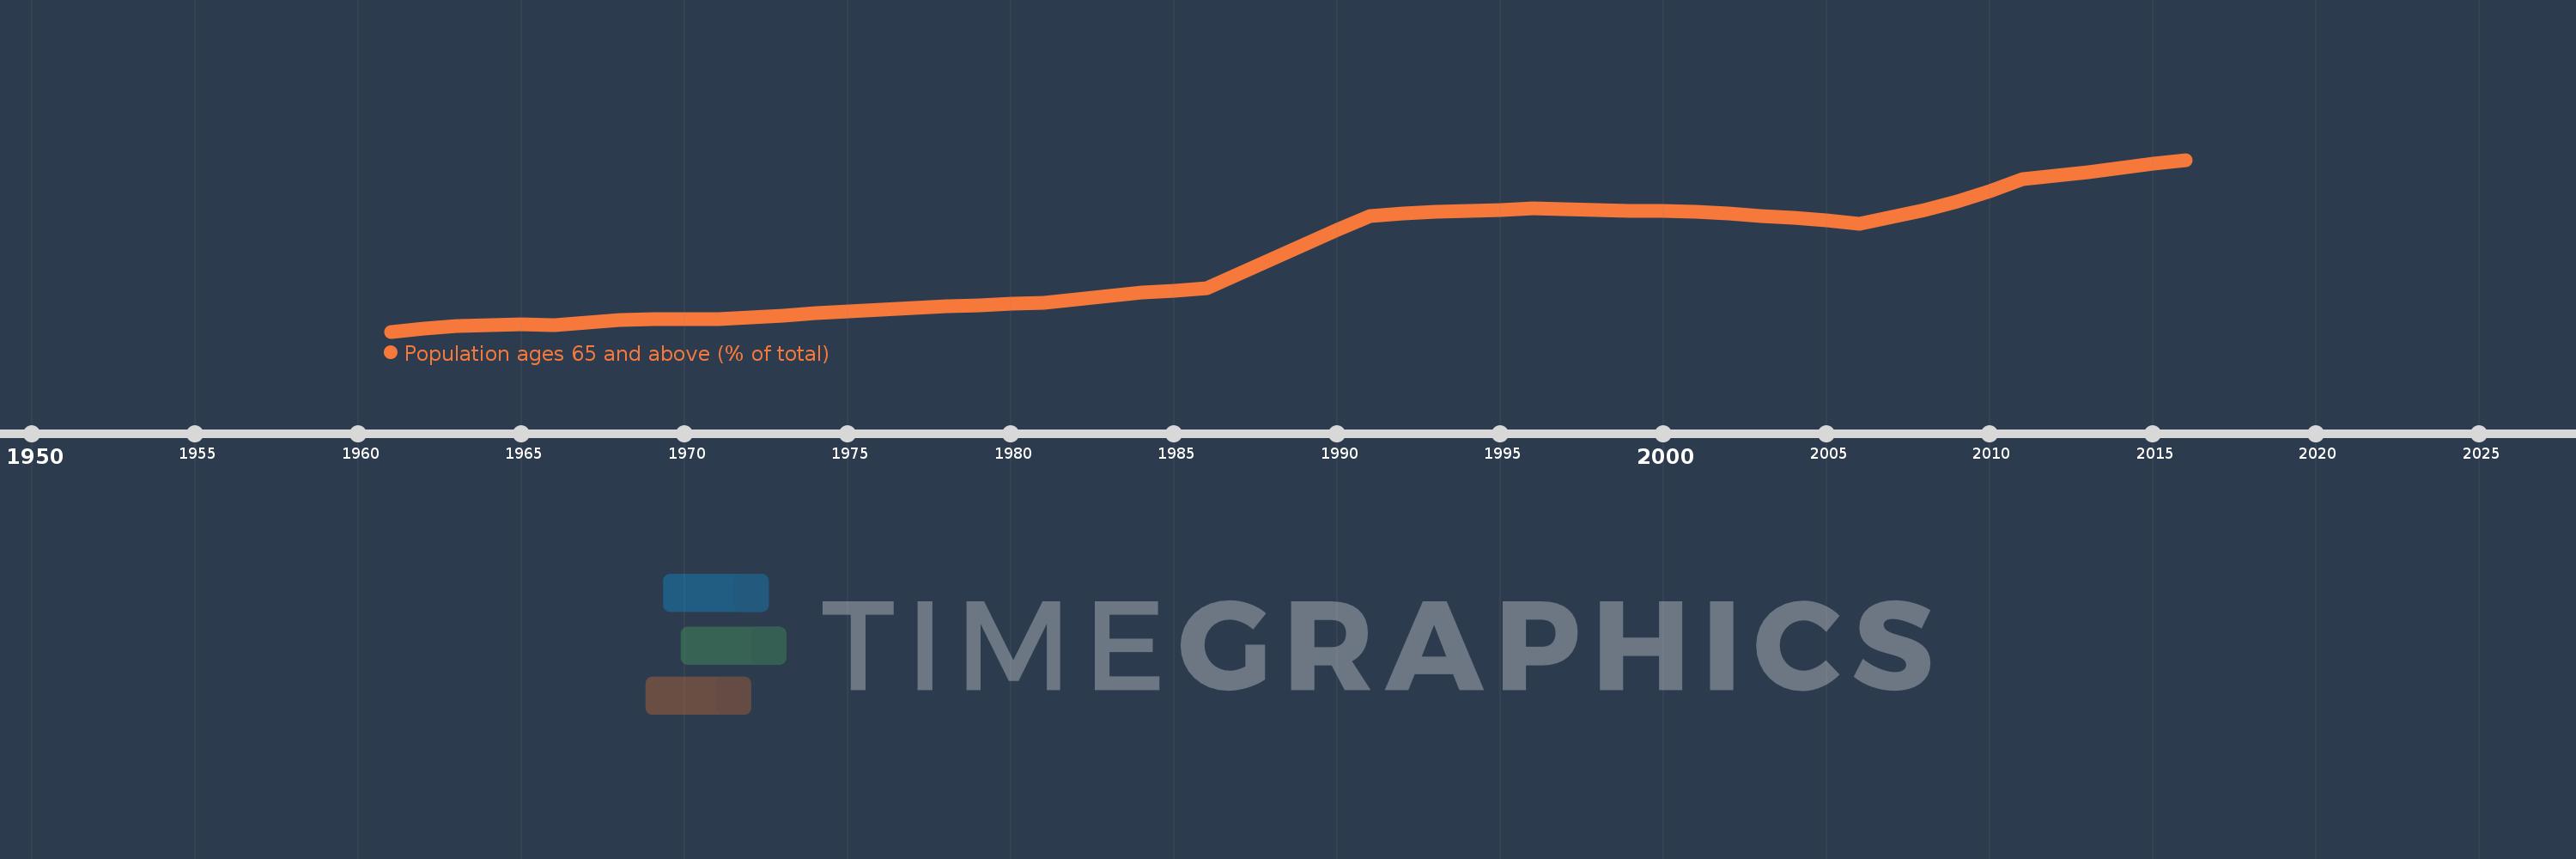
Population ages 65 and above (% of total)
2016,2015,2014,2013,2012,2011,2010,2009,2008,2007,2006,2005,2004,2003,2002,2001,2000,1999,1998,1997,1996,1995,1994,1993,1992,1991,1990,1989,1988,1987,1986,1985,1984,1983,1982,1981,1980,1979,1978,1977,1976,1975,1974,1973,1972,1971,1970,1969,1968,1967,1966,1965,1964,1963,1962,1961
This statistics in other country:
AfghanistanAlbaniaAlgeriaAngolaAntigua and BarbudaArab WorldArgentinaArmeniaArubaAustraliaAustriaAzerbaijanBahamas, TheBahrainBangladeshBarbadosBelarusBelgiumBelizeBeninBhutanBoliviaBosnia and HerzegovinaBotswanaBrazilBrunei DarussalamBulgariaBurkina FasoBurundiCabo VerdeCambodiaCameroonCanadaCaribbean small statesCentral African RepublicCentral Europe and the BalticsChadChannel IslandsChileChinaColombiaComorosCongo, Dem. Rep.Congo, Rep.Costa RicaCote d'IvoireCroatiaCubaCuracaoCyprusCzech RepublicDenmarkDjiboutiDominican RepublicEarly-demographic dividendEast Asia & PacificEast Asia & Pacific (excluding high income)East Asia & Pacific (IDA & IBRD countries)EcuadorEgypt, Arab Rep.El SalvadorEquatorial GuineaEritreaEstoniaEthiopiaEuro areaEurope & Central AsiaEurope & Central Asia (excluding high income)Europe & Central Asia (IDA & IBRD countries)European UnionFijiFinlandFragile and conflict affected situationsFranceFrench PolynesiaGabonGambia, TheGeorgiaGermanyGhanaGreeceGrenadaGuamGuatemalaGuineaGuinea-BissauGuyanaHaitiHeavily indebted poor countries (HIPC)High incomeHondurasHong Kong SAR, ChinaHungaryIBRD onlyIcelandIDA & IBRD totalIDA blendIDA onlyIDA totalIndiaIndonesiaIran, Islamic Rep.IraqIrelandIsraelItalyJamaicaJapanJordanKazakhstanKenyaKiribatiKorea, Dem. People’s Rep.Korea, Rep.KosovoKuwaitKyrgyz RepublicLao PDRLate-demographic dividendLatin America & Caribbean Latin America & Caribbean (excluding high income)Latin America & the Caribbean (IDA & IBRD countries)LatviaLeast developed countries: UN classificationLebanonLesothoLiberiaLibyaLithuaniaLow & middle incomeLow incomeLower middle incomeLuxembourgMacao SAR, ChinaMacedonia, FYRMadagascarMalawiMalaysiaMaldivesMaliMaltaMauritaniaMauritiusMexicoMicronesia, Fed. Sts.Middle East & North AfricaMiddle East & North Africa (excluding high income)Middle East & North Africa (IDA & IBRD countries)Middle incomeMoldovaMongoliaMontenegroMoroccoMozambiqueMyanmarNamibiaNepalNetherlandsNew CaledoniaNew ZealandNicaraguaNigerNigeriaNorth AmericaNorwayOECD membersOmanOther small statesPacific island small statesPakistanPanamaPapua New GuineaParaguayPeruPhilippinesPolandPortugalPost-demographic dividendPre-demographic dividendPuerto RicoQatarRomaniaRussian FederationRwandaSamoaSao Tome and PrincipeSaudi ArabiaSenegalSerbiaSeychellesSierra LeoneSingaporeSlovak RepublicSloveniaSmall statesSolomon IslandsSomaliaSouth AfricaSouth AsiaSouth Asia (IDA & IBRD)South SudanSpainSri LankaSt. LuciaSt. Vincent and the GrenadinesSub-Saharan Africa Sub-Saharan Africa (excluding high income)Sub-Saharan Africa (IDA & IBRD countries)SudanSurinameSwazilandSwedenSwitzerlandSyrian Arab RepublicTajikistanTanzaniaThailandTimor-LesteTogoTongaTrinidad and TobagoTunisiaTurkeyTurkmenistanUgandaUkraineUnited Arab EmiratesUnited KingdomUnited StatesUpper middle incomeUruguayUzbekistanVanuatuVenezuela, RBVietnamVirgin Islands (U.S.)West Bank and GazaWorldYemen, Rep.ZambiaZimbabwe Timeline:
This timeline shows a graph from 1961 to 2016 of St. Lucia. No data until 1960. Number of actual observations by date: 56.
Source name:
World Development Indicators
Source organization:
World Bank staff estimates based on age distributions of United Nations Population Division's World Population Prospects.
Categories, topics:
Health
Last updated:
apr 23, 2017
Indicators value changes by year
At the date of observation
Value
Absolute change
Change from previous value
jan 1, 1961
4.288
+4.288
0.0%
jan 1, 1962
4.362
+0.074
1.73%
jan 1, 1963
4.433
+0.07
1.61%
jan 1, 1964
4.476
+0.043
0.96%
jan 1, 1965
4.479
+0.004
0.09%
jan 1, 1966
4.467
-0.012
-0.27%
jan 1, 1967
4.536
+0.069
1.55%
jan 1, 1968
4.597
+0.06
1.33%
jan 1, 1969
4.627
+0.031
0.66%
jan 1, 1970
4.628
+0.001
0.01%
jan 1, 1971
4.624
-0.004
-0.09%
jan 1, 1972
4.682
+0.058
1.26%
jan 1, 1973
4.734
+0.053
1.12%
jan 1, 1974
4.787
+0.053
1.11%
jan 1, 1975
4.834
+0.047
0.97%
jan 1, 1976
4.887
+0.054
1.12%
jan 1, 1977
4.939
+0.052
1.06%
jan 1, 1978
4.982
+0.043
0.87%
jan 1, 1979
5.017
+0.035
0.7%
jan 1, 1980
5.046
+0.029
0.58%
jan 1, 1981
5.084
+0.038
0.75%
jan 1, 1982
5.176
+0.092
1.81%
jan 1, 1983
5.269
+0.093
1.79%
jan 1, 1984
5.351
+0.083
1.57%
jan 1, 1985
5.417
+0.065
1.22%
jan 1, 1986
5.467
+0.05
0.93%
jan 1, 1987
5.867
+0.4
7.32%
jan 1, 1988
6.273
+0.406
6.93%
jan 1, 1989
6.673
+0.399
6.36%
jan 1, 1990
7.068
+0.395
5.92%
jan 1, 1991
7.466
+0.399
5.64%
jan 1, 1992
7.526
+0.06
0.8%
jan 1, 1993
7.565
+0.039
0.52%
jan 1, 1994
7.595
+0.03
0.39%
jan 1, 1995
7.627
+0.032
0.42%
jan 1, 1996
7.673
+0.047
0.61%
jan 1, 1997
7.643
-0.031
-0.4%
jan 1, 1998
7.618
-0.025
-0.32%
jan 1, 1999
7.605
-0.014
-0.18%
jan 1, 2000
7.591
-0.014
-0.18%
jan 1, 2001
7.571
-0.02
-0.26%
jan 1, 2002
7.516
-0.055
-0.72%
jan 1, 2003
7.459
-0.057
-0.75%
jan 1, 2004
7.398
-0.061
-0.82%
jan 1, 2005
7.328
-0.07
-0.95%
jan 1, 2006
7.25
-0.078
-1.07%
jan 1, 2007
7.427
+0.177
2.44%
jan 1, 2008
7.627
+0.2
2.69%
jan 1, 2009
7.861
+0.234
3.07%
jan 1, 2010
8.143
+0.281
3.58%
jan 1, 2011
8.474
+0.331
4.07%
jan 1, 2012
8.557
+0.082
0.97%
jan 1, 2013
8.657
+0.1
1.17%
jan 1, 2014
8.768
+0.112
1.29%
jan 1, 2015
8.882
+0.114
1.3%
jan 1, 2016
8.997
+0.115
1.29%
Ranking of countries by current statistics by years


Comments: