29
/
en
AIzaSyAYiBZKx7MnpbEhh9jyipgxe19OcubqV5w
April 1, 2024
101464
Canada
CAN
true
2
1
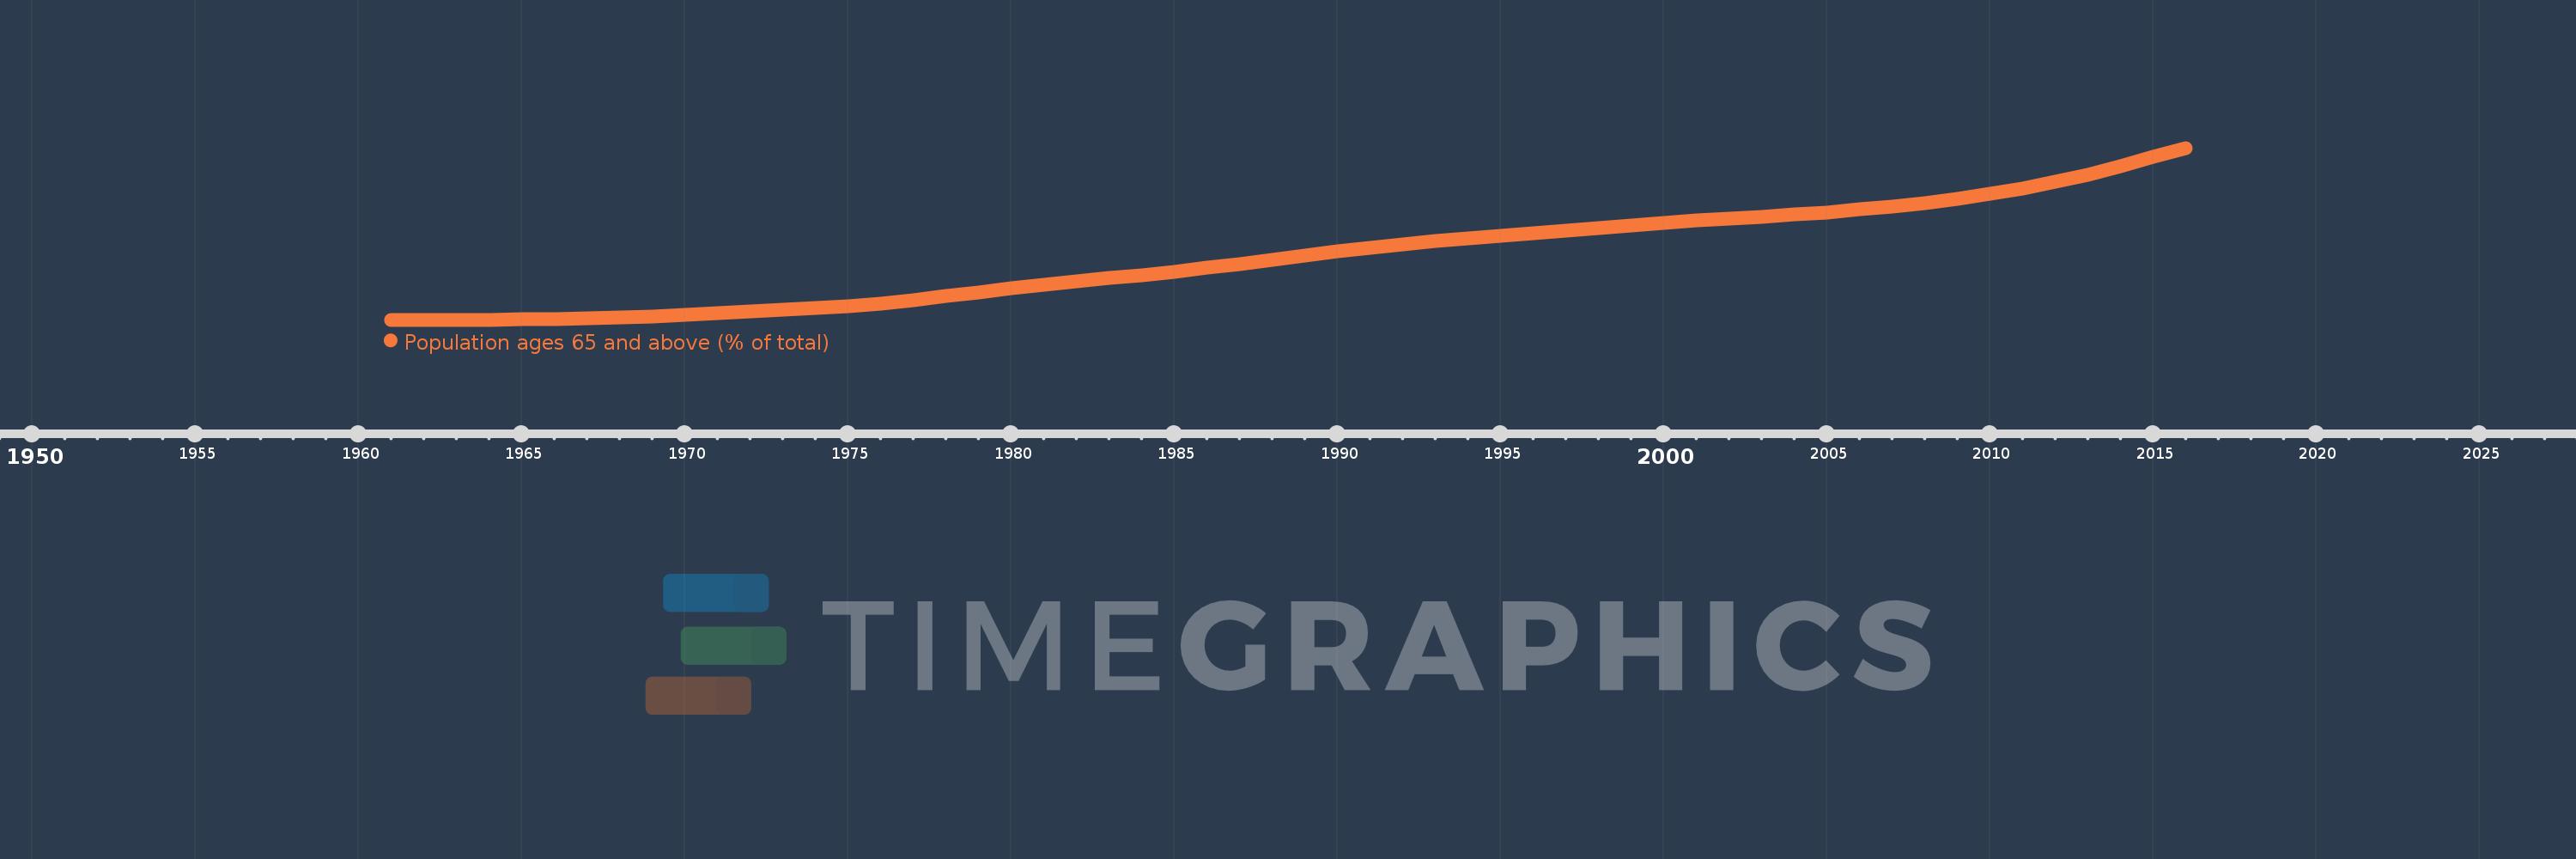
Population ages 65 and above (% of total)
2016,2015,2014,2013,2012,2011,2010,2009,2008,2007,2006,2005,2004,2003,2002,2001,2000,1999,1998,1997,1996,1995,1994,1993,1992,1991,1990,1989,1988,1987,1986,1985,1984,1983,1982,1981,1980,1979,1978,1977,1976,1975,1974,1973,1972,1971,1970,1969,1968,1967,1966,1965,1964,1963,1962,1961
This statistics in other country:
AfghanistanAlbaniaAlgeriaAngolaAntigua and BarbudaArab WorldArgentinaArmeniaArubaAustraliaAustriaAzerbaijanBahamas, TheBahrainBangladeshBarbadosBelarusBelgiumBelizeBeninBhutanBoliviaBosnia and HerzegovinaBotswanaBrazilBrunei DarussalamBulgariaBurkina FasoBurundiCabo VerdeCambodiaCameroonCanadaCaribbean small statesCentral African RepublicCentral Europe and the BalticsChadChannel IslandsChileChinaColombiaComorosCongo, Dem. Rep.Congo, Rep.Costa RicaCote d'IvoireCroatiaCubaCuracaoCyprusCzech RepublicDenmarkDjiboutiDominican RepublicEarly-demographic dividendEast Asia & PacificEast Asia & Pacific (excluding high income)East Asia & Pacific (IDA & IBRD countries)EcuadorEgypt, Arab Rep.El SalvadorEquatorial GuineaEritreaEstoniaEthiopiaEuro areaEurope & Central AsiaEurope & Central Asia (excluding high income)Europe & Central Asia (IDA & IBRD countries)European UnionFijiFinlandFragile and conflict affected situationsFranceFrench PolynesiaGabonGambia, TheGeorgiaGermanyGhanaGreeceGrenadaGuamGuatemalaGuineaGuinea-BissauGuyanaHaitiHeavily indebted poor countries (HIPC)High incomeHondurasHong Kong SAR, ChinaHungaryIBRD onlyIcelandIDA & IBRD totalIDA blendIDA onlyIDA totalIndiaIndonesiaIran, Islamic Rep.IraqIrelandIsraelItalyJamaicaJapanJordanKazakhstanKenyaKiribatiKorea, Dem. People’s Rep.Korea, Rep.KosovoKuwaitKyrgyz RepublicLao PDRLate-demographic dividendLatin America & Caribbean Latin America & Caribbean (excluding high income)Latin America & the Caribbean (IDA & IBRD countries)LatviaLeast developed countries: UN classificationLebanonLesothoLiberiaLibyaLithuaniaLow & middle incomeLow incomeLower middle incomeLuxembourgMacao SAR, ChinaMacedonia, FYRMadagascarMalawiMalaysiaMaldivesMaliMaltaMauritaniaMauritiusMexicoMicronesia, Fed. Sts.Middle East & North AfricaMiddle East & North Africa (excluding high income)Middle East & North Africa (IDA & IBRD countries)Middle incomeMoldovaMongoliaMontenegroMoroccoMozambiqueMyanmarNamibiaNepalNetherlandsNew CaledoniaNew ZealandNicaraguaNigerNigeriaNorth AmericaNorwayOECD membersOmanOther small statesPacific island small statesPakistanPanamaPapua New GuineaParaguayPeruPhilippinesPolandPortugalPost-demographic dividendPre-demographic dividendPuerto RicoQatarRomaniaRussian FederationRwandaSamoaSao Tome and PrincipeSaudi ArabiaSenegalSerbiaSeychellesSierra LeoneSingaporeSlovak RepublicSloveniaSmall statesSolomon IslandsSomaliaSouth AfricaSouth AsiaSouth Asia (IDA & IBRD)South SudanSpainSri LankaSt. LuciaSt. Vincent and the GrenadinesSub-Saharan Africa Sub-Saharan Africa (excluding high income)Sub-Saharan Africa (IDA & IBRD countries)SudanSurinameSwazilandSwedenSwitzerlandSyrian Arab RepublicTajikistanTanzaniaThailandTimor-LesteTogoTongaTrinidad and TobagoTunisiaTurkeyTurkmenistanUgandaUkraineUnited Arab EmiratesUnited KingdomUnited StatesUpper middle incomeUruguayUzbekistanVanuatuVenezuela, RBVietnamVirgin Islands (U.S.)West Bank and GazaWorldYemen, Rep.ZambiaZimbabwe Timeline:
This timeline shows a graph from 1961 to 2016 of Canada. No data until 1960. Number of actual observations by date: 56.
Source name:
World Development Indicators
Source organization:
World Bank staff estimates based on age distributions of United Nations Population Division's World Population Prospects.
Categories, topics:
Health
Last updated:
apr 23, 2017
Indicators value changes by year
Maximum:
16.136
jan 1, 2016
At the date of observation
Value
Absolute change
Change from previous value
jan 1, 1961
7.672
+7.672
0.0%
jan 1, 1962
7.674
+0.002
0.02%
jan 1, 1963
7.675
+0.001
0.02%
jan 1, 1964
7.68
+0.005
0.07%
jan 1, 1965
7.694
+0.014
0.18%
jan 1, 1966
7.719
+0.025
0.33%
jan 1, 1967
7.74
+0.021
0.27%
jan 1, 1968
7.78
+0.04
0.52%
jan 1, 1969
7.838
+0.057
0.74%
jan 1, 1970
7.906
+0.069
0.88%
jan 1, 1971
7.983
+0.077
0.97%
jan 1, 1972
8.075
+0.092
1.15%
jan 1, 1973
8.157
+0.082
1.01%
jan 1, 1974
8.241
+0.084
1.03%
jan 1, 1975
8.344
+0.102
1.24%
jan 1, 1976
8.47
+0.127
1.52%
jan 1, 1977
8.639
+0.168
1.99%
jan 1, 1978
8.827
+0.189
2.18%
jan 1, 1979
9.025
+0.198
2.24%
jan 1, 1980
9.216
+0.191
2.11%
jan 1, 1981
9.392
+0.176
1.91%
jan 1, 1982
9.56
+0.168
1.79%
jan 1, 1983
9.714
+0.154
1.61%
jan 1, 1984
9.868
+0.153
1.58%
jan 1, 1985
10.038
+0.17
1.72%
jan 1, 1986
10.232
+0.195
1.94%
jan 1, 1987
10.41
+0.178
1.74%
jan 1, 1988
10.608
+0.198
1.9%
jan 1, 1989
10.819
+0.21
1.98%
jan 1, 1990
11.027
+0.209
1.93%
jan 1, 1991
11.227
+0.199
1.81%
jan 1, 1992
11.39
+0.163
1.46%
jan 1, 1993
11.537
+0.146
1.29%
jan 1, 1994
11.672
+0.135
1.17%
jan 1, 1995
11.804
+0.132
1.13%
jan 1, 1996
11.937
+0.134
1.13%
jan 1, 1997
12.057
+0.12
1.01%
jan 1, 1998
12.184
+0.127
1.05%
jan 1, 1999
12.313
+0.129
1.06%
jan 1, 2000
12.435
+0.122
0.99%
jan 1, 2001
12.548
+0.112
0.9%
jan 1, 2002
12.653
+0.106
0.84%
jan 1, 2003
12.749
+0.095
0.75%
jan 1, 2004
12.847
+0.098
0.77%
jan 1, 2005
12.964
+0.117
0.91%
jan 1, 2006
13.108
+0.144
1.11%
jan 1, 2007
13.254
+0.146
1.11%
jan 1, 2008
13.423
+0.169
1.28%
jan 1, 2009
13.623
+0.2
1.49%
jan 1, 2010
13.864
+0.241
1.77%
jan 1, 2011
14.153
+0.289
2.09%
jan 1, 2012
14.458
+0.306
2.16%
jan 1, 2013
14.827
+0.368
2.55%
jan 1, 2014
15.247
+0.42
2.83%
jan 1, 2015
15.691
+0.444
2.91%
jan 1, 2016
16.136
+0.445
2.83%
Ranking of countries by current statistics by years


Comments: