29
/
en
AIzaSyAYiBZKx7MnpbEhh9jyipgxe19OcubqV5w
April 1, 2024
220028
Papua New Guinea
PNG
true
2
1
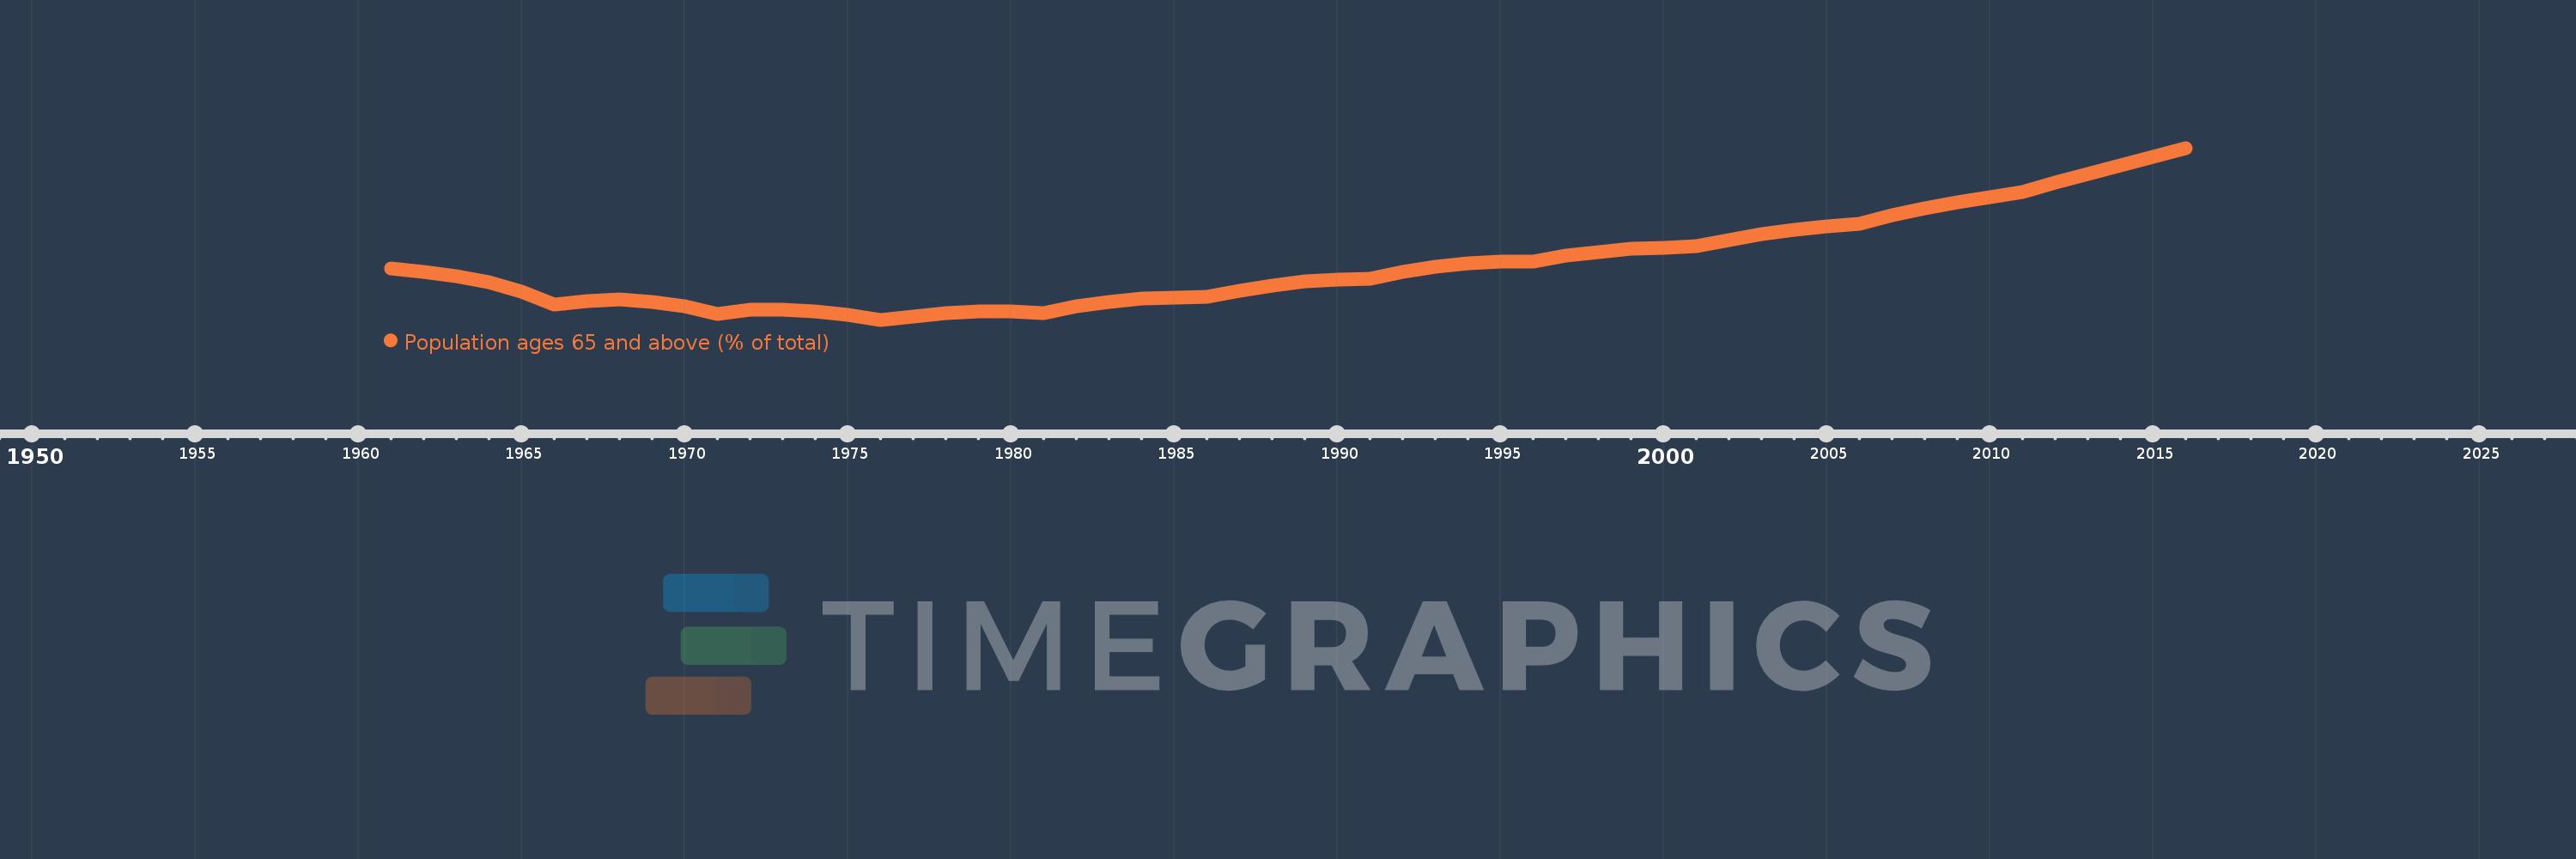
Population ages 65 and above (% of total)
2016,2015,2014,2013,2012,2011,2010,2009,2008,2007,2006,2005,2004,2003,2002,2001,2000,1999,1998,1997,1996,1995,1994,1993,1992,1991,1990,1989,1988,1987,1986,1985,1984,1983,1982,1981,1980,1979,1978,1977,1976,1975,1974,1973,1972,1971,1970,1969,1968,1967,1966,1965,1964,1963,1962,1961
This statistics in other country:
AfghanistanAlbaniaAlgeriaAngolaAntigua and BarbudaArab WorldArgentinaArmeniaArubaAustraliaAustriaAzerbaijanBahamas, TheBahrainBangladeshBarbadosBelarusBelgiumBelizeBeninBhutanBoliviaBosnia and HerzegovinaBotswanaBrazilBrunei DarussalamBulgariaBurkina FasoBurundiCabo VerdeCambodiaCameroonCanadaCaribbean small statesCentral African RepublicCentral Europe and the BalticsChadChannel IslandsChileChinaColombiaComorosCongo, Dem. Rep.Congo, Rep.Costa RicaCote d'IvoireCroatiaCubaCuracaoCyprusCzech RepublicDenmarkDjiboutiDominican RepublicEarly-demographic dividendEast Asia & PacificEast Asia & Pacific (excluding high income)East Asia & Pacific (IDA & IBRD countries)EcuadorEgypt, Arab Rep.El SalvadorEquatorial GuineaEritreaEstoniaEthiopiaEuro areaEurope & Central AsiaEurope & Central Asia (excluding high income)Europe & Central Asia (IDA & IBRD countries)European UnionFijiFinlandFragile and conflict affected situationsFranceFrench PolynesiaGabonGambia, TheGeorgiaGermanyGhanaGreeceGrenadaGuamGuatemalaGuineaGuinea-BissauGuyanaHaitiHeavily indebted poor countries (HIPC)High incomeHondurasHong Kong SAR, ChinaHungaryIBRD onlyIcelandIDA & IBRD totalIDA blendIDA onlyIDA totalIndiaIndonesiaIran, Islamic Rep.IraqIrelandIsraelItalyJamaicaJapanJordanKazakhstanKenyaKiribatiKorea, Dem. People’s Rep.Korea, Rep.KosovoKuwaitKyrgyz RepublicLao PDRLate-demographic dividendLatin America & Caribbean Latin America & Caribbean (excluding high income)Latin America & the Caribbean (IDA & IBRD countries)LatviaLeast developed countries: UN classificationLebanonLesothoLiberiaLibyaLithuaniaLow & middle incomeLow incomeLower middle incomeLuxembourgMacao SAR, ChinaMacedonia, FYRMadagascarMalawiMalaysiaMaldivesMaliMaltaMauritaniaMauritiusMexicoMicronesia, Fed. Sts.Middle East & North AfricaMiddle East & North Africa (excluding high income)Middle East & North Africa (IDA & IBRD countries)Middle incomeMoldovaMongoliaMontenegroMoroccoMozambiqueMyanmarNamibiaNepalNetherlandsNew CaledoniaNew ZealandNicaraguaNigerNigeriaNorth AmericaNorwayOECD membersOmanOther small statesPacific island small statesPakistanPanamaPapua New GuineaParaguayPeruPhilippinesPolandPortugalPost-demographic dividendPre-demographic dividendPuerto RicoQatarRomaniaRussian FederationRwandaSamoaSao Tome and PrincipeSaudi ArabiaSenegalSerbiaSeychellesSierra LeoneSingaporeSlovak RepublicSloveniaSmall statesSolomon IslandsSomaliaSouth AfricaSouth AsiaSouth Asia (IDA & IBRD)South SudanSpainSri LankaSt. LuciaSt. Vincent and the GrenadinesSub-Saharan Africa Sub-Saharan Africa (excluding high income)Sub-Saharan Africa (IDA & IBRD countries)SudanSurinameSwazilandSwedenSwitzerlandSyrian Arab RepublicTajikistanTanzaniaThailandTimor-LesteTogoTongaTrinidad and TobagoTunisiaTurkeyTurkmenistanUgandaUkraineUnited Arab EmiratesUnited KingdomUnited StatesUpper middle incomeUruguayUzbekistanVanuatuVenezuela, RBVietnamVirgin Islands (U.S.)West Bank and GazaWorldYemen, Rep.ZambiaZimbabwe Timeline:
This timeline shows a graph from 1961 to 2016 of Papua New Guinea. No data until 1960. Number of actual observations by date: 56.
Source name:
World Development Indicators
Source organization:
World Bank staff estimates based on age distributions of United Nations Population Division's World Population Prospects.
Categories, topics:
Health
Last updated:
apr 23, 2017
Indicators value changes by year
At the date of observation
Value
Absolute change
Change from previous value
jan 1, 1961
2.383
+2.383
0.0%
jan 1, 1962
2.366
-0.017
-0.71%
jan 1, 1963
2.344
-0.022
-0.92%
jan 1, 1964
2.312
-0.032
-1.38%
jan 1, 1965
2.264
-0.048
-2.07%
jan 1, 1966
2.198
-0.065
-2.89%
jan 1, 1967
2.217
+0.018
0.83%
jan 1, 1968
2.222
+0.005
0.22%
jan 1, 1969
2.212
-0.009
-0.41%
jan 1, 1970
2.188
-0.024
-1.1%
jan 1, 1971
2.148
-0.04
-1.81%
jan 1, 1972
2.169
+0.02
0.94%
jan 1, 1973
2.172
+0.004
0.17%
jan 1, 1974
2.162
-0.01
-0.47%
jan 1, 1975
2.143
-0.019
-0.88%
jan 1, 1976
2.118
-0.025
-1.17%
jan 1, 1977
2.136
+0.018
0.84%
jan 1, 1978
2.151
+0.016
0.73%
jan 1, 1979
2.161
+0.01
0.47%
jan 1, 1980
2.162
+0.0
0.01%
jan 1, 1981
2.151
-0.011
-0.5%
jan 1, 1982
2.188
+0.037
1.73%
jan 1, 1983
2.212
+0.024
1.1%
jan 1, 1984
2.226
+0.014
0.62%
jan 1, 1985
2.234
+0.008
0.37%
jan 1, 1986
2.239
+0.005
0.23%
jan 1, 1987
2.27
+0.031
1.39%
jan 1, 1988
2.296
+0.026
1.13%
jan 1, 1989
2.316
+0.02
0.85%
jan 1, 1990
2.327
+0.011
0.49%
jan 1, 1991
2.33
+0.003
0.12%
jan 1, 1992
2.367
+0.037
1.59%
jan 1, 1993
2.393
+0.026
1.1%
jan 1, 1994
2.409
+0.016
0.68%
jan 1, 1995
2.418
+0.009
0.36%
jan 1, 1996
2.42
+0.002
0.09%
jan 1, 1997
2.449
+0.029
1.21%
jan 1, 1998
2.471
+0.021
0.87%
jan 1, 1999
2.485
+0.014
0.57%
jan 1, 2000
2.493
+0.008
0.34%
jan 1, 2001
2.498
+0.005
0.18%
jan 1, 2002
2.532
+0.034
1.36%
jan 1, 2003
2.561
+0.029
1.16%
jan 1, 2004
2.585
+0.024
0.95%
jan 1, 2005
2.604
+0.018
0.71%
jan 1, 2006
2.616
+0.013
0.49%
jan 1, 2007
2.661
+0.044
1.69%
jan 1, 2008
2.698
+0.037
1.39%
jan 1, 2009
2.729
+0.031
1.16%
jan 1, 2010
2.756
+0.028
1.01%
jan 1, 2011
2.782
+0.026
0.94%
jan 1, 2012
2.832
+0.049
1.77%
jan 1, 2013
2.877
+0.045
1.58%
jan 1, 2014
2.919
+0.043
1.49%
jan 1, 2015
2.963
+0.044
1.5%
jan 1, 2016
3.01
+0.047
1.57%
Ranking of countries by current statistics by years


Comments: