29
/
en
AIzaSyAYiBZKx7MnpbEhh9jyipgxe19OcubqV5w
April 1, 2024
26045
Central Europe and the Baltics
CEB
false
2
1
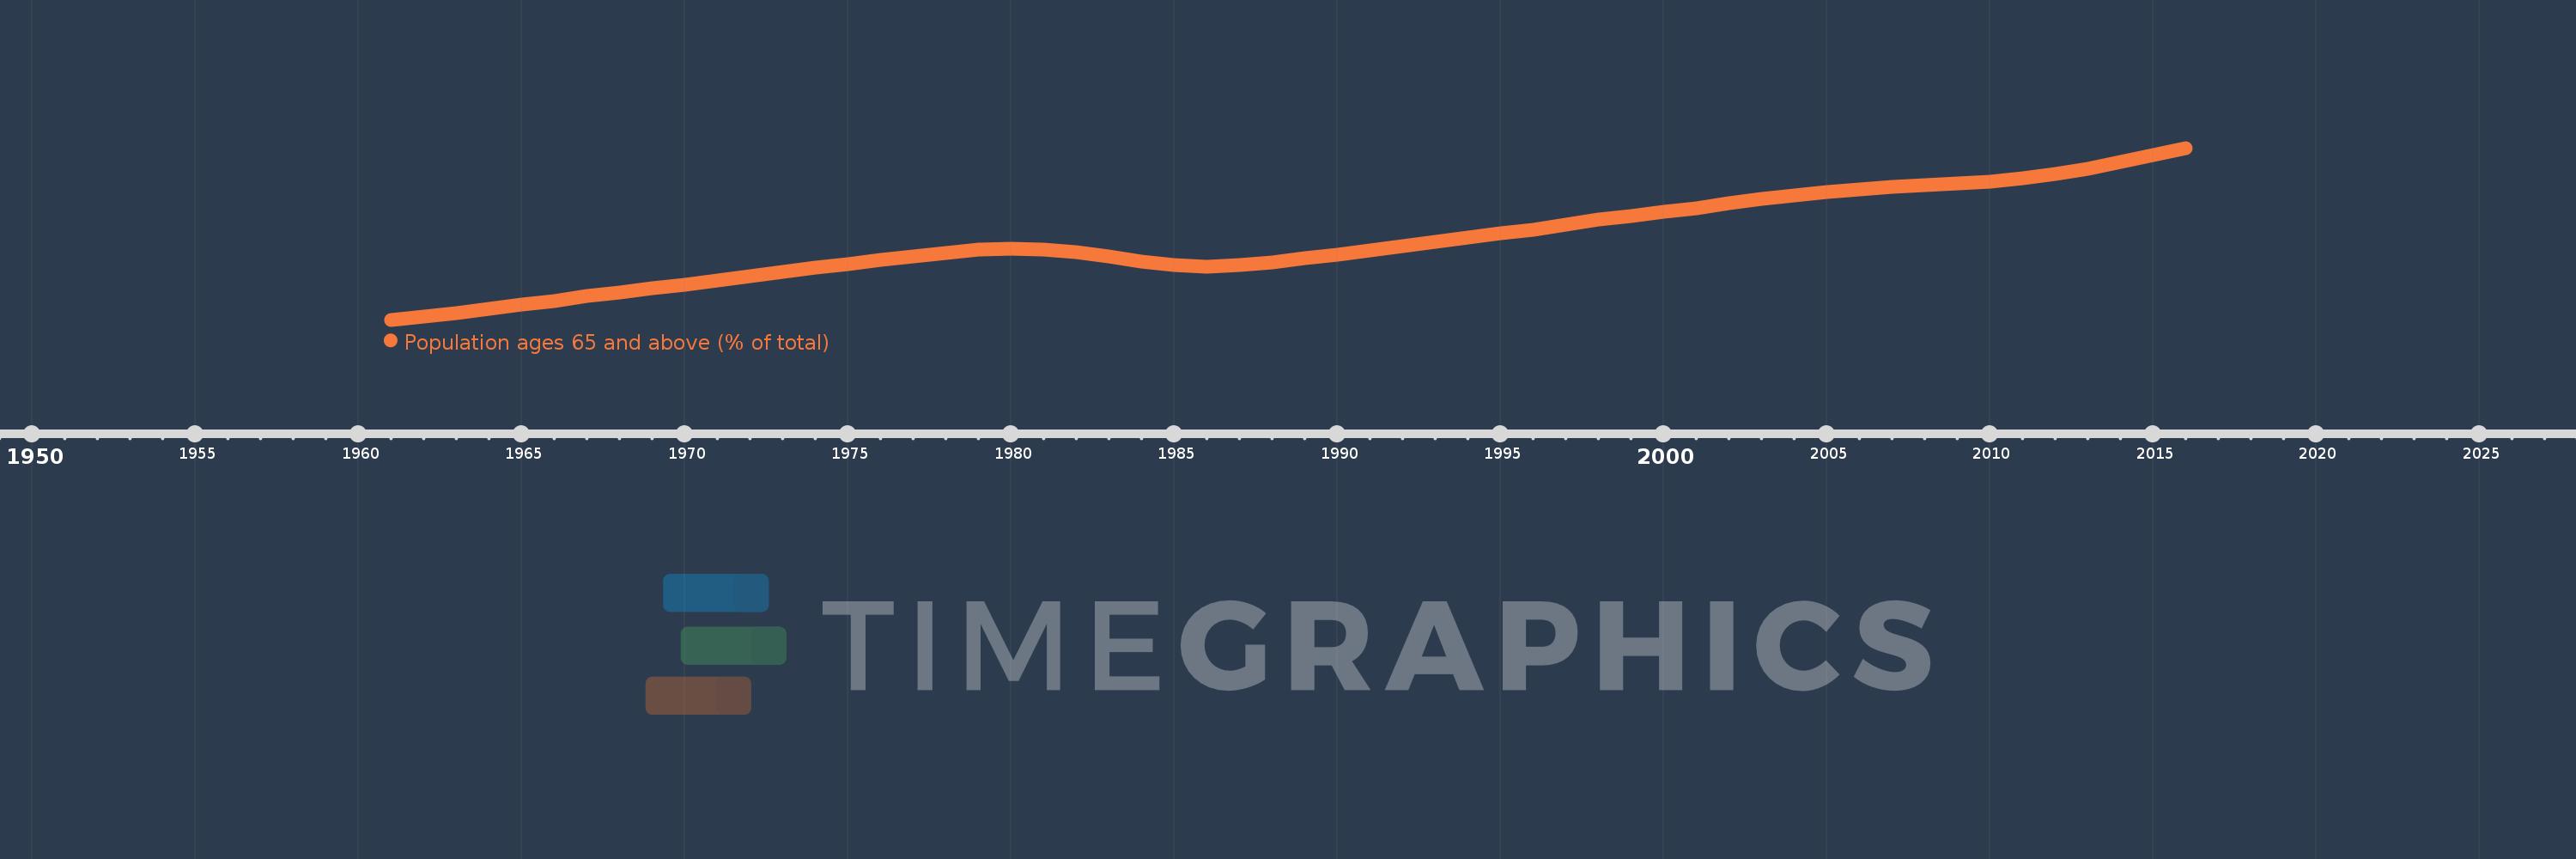
Population ages 65 and above (% of total)
2016,2015,2014,2013,2012,2011,2010,2009,2008,2007,2006,2005,2004,2003,2002,2001,2000,1999,1998,1997,1996,1995,1994,1993,1992,1991,1990,1989,1988,1987,1986,1985,1984,1983,1982,1981,1980,1979,1978,1977,1976,1975,1974,1973,1972,1971,1970,1969,1968,1967,1966,1965,1964,1963,1962,1961
This statistics in other country:
AfghanistanAlbaniaAlgeriaAngolaAntigua and BarbudaArab WorldArgentinaArmeniaArubaAustraliaAustriaAzerbaijanBahamas, TheBahrainBangladeshBarbadosBelarusBelgiumBelizeBeninBhutanBoliviaBosnia and HerzegovinaBotswanaBrazilBrunei DarussalamBulgariaBurkina FasoBurundiCabo VerdeCambodiaCameroonCanadaCaribbean small statesCentral African RepublicCentral Europe and the BalticsChadChannel IslandsChileChinaColombiaComorosCongo, Dem. Rep.Congo, Rep.Costa RicaCote d'IvoireCroatiaCubaCuracaoCyprusCzech RepublicDenmarkDjiboutiDominican RepublicEarly-demographic dividendEast Asia & PacificEast Asia & Pacific (excluding high income)East Asia & Pacific (IDA & IBRD countries)EcuadorEgypt, Arab Rep.El SalvadorEquatorial GuineaEritreaEstoniaEthiopiaEuro areaEurope & Central AsiaEurope & Central Asia (excluding high income)Europe & Central Asia (IDA & IBRD countries)European UnionFijiFinlandFragile and conflict affected situationsFranceFrench PolynesiaGabonGambia, TheGeorgiaGermanyGhanaGreeceGrenadaGuamGuatemalaGuineaGuinea-BissauGuyanaHaitiHeavily indebted poor countries (HIPC)High incomeHondurasHong Kong SAR, ChinaHungaryIBRD onlyIcelandIDA & IBRD totalIDA blendIDA onlyIDA totalIndiaIndonesiaIran, Islamic Rep.IraqIrelandIsraelItalyJamaicaJapanJordanKazakhstanKenyaKiribatiKorea, Dem. People’s Rep.Korea, Rep.KosovoKuwaitKyrgyz RepublicLao PDRLate-demographic dividendLatin America & Caribbean Latin America & Caribbean (excluding high income)Latin America & the Caribbean (IDA & IBRD countries)LatviaLeast developed countries: UN classificationLebanonLesothoLiberiaLibyaLithuaniaLow & middle incomeLow incomeLower middle incomeLuxembourgMacao SAR, ChinaMacedonia, FYRMadagascarMalawiMalaysiaMaldivesMaliMaltaMauritaniaMauritiusMexicoMicronesia, Fed. Sts.Middle East & North AfricaMiddle East & North Africa (excluding high income)Middle East & North Africa (IDA & IBRD countries)Middle incomeMoldovaMongoliaMontenegroMoroccoMozambiqueMyanmarNamibiaNepalNetherlandsNew CaledoniaNew ZealandNicaraguaNigerNigeriaNorth AmericaNorwayOECD membersOmanOther small statesPacific island small statesPakistanPanamaPapua New GuineaParaguayPeruPhilippinesPolandPortugalPost-demographic dividendPre-demographic dividendPuerto RicoQatarRomaniaRussian FederationRwandaSamoaSao Tome and PrincipeSaudi ArabiaSenegalSerbiaSeychellesSierra LeoneSingaporeSlovak RepublicSloveniaSmall statesSolomon IslandsSomaliaSouth AfricaSouth AsiaSouth Asia (IDA & IBRD)South SudanSpainSri LankaSt. LuciaSt. Vincent and the GrenadinesSub-Saharan Africa Sub-Saharan Africa (excluding high income)Sub-Saharan Africa (IDA & IBRD countries)SudanSurinameSwazilandSwedenSwitzerlandSyrian Arab RepublicTajikistanTanzaniaThailandTimor-LesteTogoTongaTrinidad and TobagoTunisiaTurkeyTurkmenistanUgandaUkraineUnited Arab EmiratesUnited KingdomUnited StatesUpper middle incomeUruguayUzbekistanVanuatuVenezuela, RBVietnamVirgin Islands (U.S.)West Bank and GazaWorldYemen, Rep.ZambiaZimbabwe Timeline:
This timeline shows a graph from 1961 to 2016 of Central Europe and the Baltics. No data until 1960. Number of actual observations by date: 56.
Source name:
World Development Indicators
Source organization:
World Bank staff estimates based on age distributions of United Nations Population Division's World Population Prospects.
Categories, topics:
Health
Last updated:
apr 23, 2017
Indicators value changes by year
Maximum:
16.972
jan 1, 2016
At the date of observation
Value
Absolute change
Change from previous value
jan 1, 1961
7.208
+7.208
0.0%
jan 1, 1962
7.395
+0.188
2.6%
jan 1, 1963
7.604
+0.208
2.82%
jan 1, 1964
7.827
+0.223
2.93%
jan 1, 1965
8.055
+0.229
2.92%
jan 1, 1966
8.286
+0.231
2.87%
jan 1, 1967
8.536
+0.249
3.01%
jan 1, 1968
8.762
+0.226
2.65%
jan 1, 1969
8.978
+0.216
2.47%
jan 1, 1970
9.201
+0.223
2.48%
jan 1, 1971
9.436
+0.236
2.56%
jan 1, 1972
9.679
+0.243
2.57%
jan 1, 1973
9.921
+0.241
2.49%
jan 1, 1974
10.157
+0.236
2.38%
jan 1, 1975
10.381
+0.224
2.21%
jan 1, 1976
10.588
+0.207
2.0%
jan 1, 1977
10.809
+0.221
2.09%
jan 1, 1978
11.02
+0.211
1.95%
jan 1, 1979
11.185
+0.165
1.5%
jan 1, 1980
11.254
+0.068
0.61%
jan 1, 1981
11.202
-0.052
-0.46%
jan 1, 1982
11.061
-0.141
-1.26%
jan 1, 1983
10.812
-0.249
-2.25%
jan 1, 1984
10.526
-0.286
-2.65%
jan 1, 1985
10.303
-0.223
-2.11%
jan 1, 1986
10.201
-0.102
-0.99%
jan 1, 1987
10.294
+0.093
0.91%
jan 1, 1988
10.47
+0.177
1.72%
jan 1, 1989
10.697
+0.227
2.17%
jan 1, 1990
10.924
+0.227
2.12%
jan 1, 1991
11.127
+0.203
1.86%
jan 1, 1992
11.398
+0.271
2.44%
jan 1, 1993
11.656
+0.257
2.26%
jan 1, 1994
11.899
+0.243
2.09%
jan 1, 1995
12.127
+0.228
1.92%
jan 1, 1996
12.34
+0.213
1.76%
jan 1, 1997
12.625
+0.285
2.31%
jan 1, 1998
12.887
+0.262
2.07%
jan 1, 1999
13.123
+0.236
1.83%
jan 1, 2000
13.343
+0.22
1.68%
jan 1, 2001
13.548
+0.205
1.54%
jan 1, 2002
13.809
+0.261
1.93%
jan 1, 2003
14.054
+0.245
1.77%
jan 1, 2004
14.279
+0.225
1.6%
jan 1, 2005
14.462
+0.183
1.28%
jan 1, 2006
14.593
+0.131
0.91%
jan 1, 2007
14.746
+0.153
1.05%
jan 1, 2008
14.851
+0.105
0.71%
jan 1, 2009
14.938
+0.088
0.59%
jan 1, 2010
15.052
+0.114
0.76%
jan 1, 2011
15.225
+0.173
1.15%
jan 1, 2012
15.489
+0.264
1.74%
jan 1, 2013
15.804
+0.314
2.03%
jan 1, 2014
16.162
+0.359
2.27%
jan 1, 2015
16.555
+0.393
2.43%
jan 1, 2016
16.972
+0.416
2.51%
Ranking of countries by current statistics by years


Comments: