29
/
en
AIzaSyAYiBZKx7MnpbEhh9jyipgxe19OcubqV5w
April 1, 2024
32012
Europe & Central Asia (excluding high income)
ECA
false
2
1
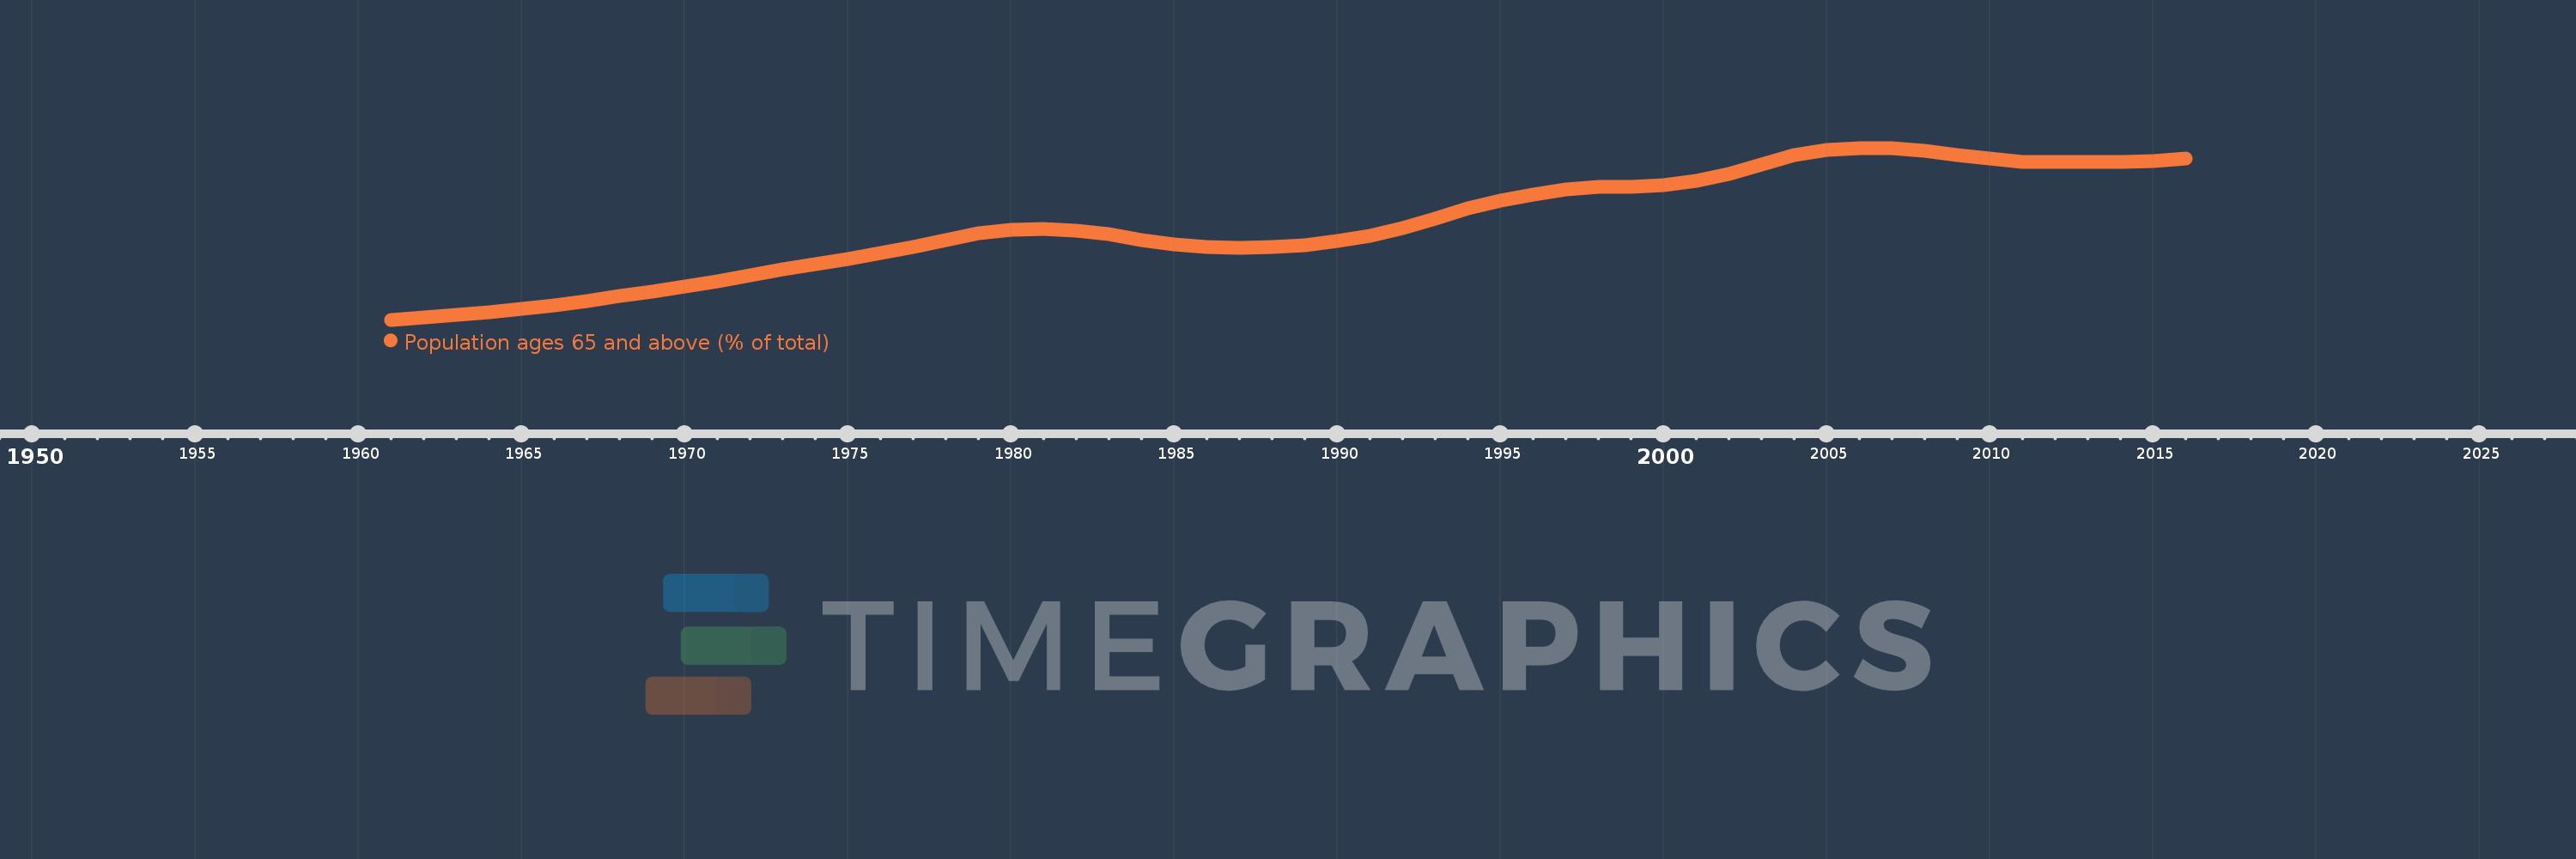
Population ages 65 and above (% of total)
2016,2015,2014,2013,2012,2011,2010,2009,2008,2007,2006,2005,2004,2003,2002,2001,2000,1999,1998,1997,1996,1995,1994,1993,1992,1991,1990,1989,1988,1987,1986,1985,1984,1983,1982,1981,1980,1979,1978,1977,1976,1975,1974,1973,1972,1971,1970,1969,1968,1967,1966,1965,1964,1963,1962,1961
This statistics in other country:
AfghanistanAlbaniaAlgeriaAngolaAntigua and BarbudaArab WorldArgentinaArmeniaArubaAustraliaAustriaAzerbaijanBahamas, TheBahrainBangladeshBarbadosBelarusBelgiumBelizeBeninBhutanBoliviaBosnia and HerzegovinaBotswanaBrazilBrunei DarussalamBulgariaBurkina FasoBurundiCabo VerdeCambodiaCameroonCanadaCaribbean small statesCentral African RepublicCentral Europe and the BalticsChadChannel IslandsChileChinaColombiaComorosCongo, Dem. Rep.Congo, Rep.Costa RicaCote d'IvoireCroatiaCubaCuracaoCyprusCzech RepublicDenmarkDjiboutiDominican RepublicEarly-demographic dividendEast Asia & PacificEast Asia & Pacific (excluding high income)East Asia & Pacific (IDA & IBRD countries)EcuadorEgypt, Arab Rep.El SalvadorEquatorial GuineaEritreaEstoniaEthiopiaEuro areaEurope & Central AsiaEurope & Central Asia (excluding high income)Europe & Central Asia (IDA & IBRD countries)European UnionFijiFinlandFragile and conflict affected situationsFranceFrench PolynesiaGabonGambia, TheGeorgiaGermanyGhanaGreeceGrenadaGuamGuatemalaGuineaGuinea-BissauGuyanaHaitiHeavily indebted poor countries (HIPC)High incomeHondurasHong Kong SAR, ChinaHungaryIBRD onlyIcelandIDA & IBRD totalIDA blendIDA onlyIDA totalIndiaIndonesiaIran, Islamic Rep.IraqIrelandIsraelItalyJamaicaJapanJordanKazakhstanKenyaKiribatiKorea, Dem. People’s Rep.Korea, Rep.KosovoKuwaitKyrgyz RepublicLao PDRLate-demographic dividendLatin America & Caribbean Latin America & Caribbean (excluding high income)Latin America & the Caribbean (IDA & IBRD countries)LatviaLeast developed countries: UN classificationLebanonLesothoLiberiaLibyaLithuaniaLow & middle incomeLow incomeLower middle incomeLuxembourgMacao SAR, ChinaMacedonia, FYRMadagascarMalawiMalaysiaMaldivesMaliMaltaMauritaniaMauritiusMexicoMicronesia, Fed. Sts.Middle East & North AfricaMiddle East & North Africa (excluding high income)Middle East & North Africa (IDA & IBRD countries)Middle incomeMoldovaMongoliaMontenegroMoroccoMozambiqueMyanmarNamibiaNepalNetherlandsNew CaledoniaNew ZealandNicaraguaNigerNigeriaNorth AmericaNorwayOECD membersOmanOther small statesPacific island small statesPakistanPanamaPapua New GuineaParaguayPeruPhilippinesPolandPortugalPost-demographic dividendPre-demographic dividendPuerto RicoQatarRomaniaRussian FederationRwandaSamoaSao Tome and PrincipeSaudi ArabiaSenegalSerbiaSeychellesSierra LeoneSingaporeSlovak RepublicSloveniaSmall statesSolomon IslandsSomaliaSouth AfricaSouth AsiaSouth Asia (IDA & IBRD)South SudanSpainSri LankaSt. LuciaSt. Vincent and the GrenadinesSub-Saharan Africa Sub-Saharan Africa (excluding high income)Sub-Saharan Africa (IDA & IBRD countries)SudanSurinameSwazilandSwedenSwitzerlandSyrian Arab RepublicTajikistanTanzaniaThailandTimor-LesteTogoTongaTrinidad and TobagoTunisiaTurkeyTurkmenistanUgandaUkraineUnited Arab EmiratesUnited KingdomUnited StatesUpper middle incomeUruguayUzbekistanVanuatuVenezuela, RBVietnamVirgin Islands (U.S.)West Bank and GazaWorldYemen, Rep.ZambiaZimbabwe Timeline:
This timeline shows a graph from 1961 to 2016 of Europe & Central Asia (excluding high income). No data until 1960. Number of actual observations by date: 56.
Source name:
World Development Indicators
Source organization:
World Bank staff estimates based on age distributions of United Nations Population Division's World Population Prospects.
Categories, topics:
Health
Last updated:
apr 23, 2017
Indicators value changes by year
Maximum:
11.533
jan 1, 2007
At the date of observation
Value
Absolute change
Change from previous value
jan 1, 1961
6.105
+6.105
0.0%
jan 1, 1962
6.186
+0.08
1.31%
jan 1, 1963
6.265
+0.08
1.29%
jan 1, 1964
6.351
+0.085
1.36%
jan 1, 1965
6.447
+0.096
1.52%
jan 1, 1966
6.558
+0.111
1.72%
jan 1, 1967
6.697
+0.139
2.12%
jan 1, 1968
6.845
+0.149
2.22%
jan 1, 1969
7.002
+0.157
2.29%
jan 1, 1970
7.163
+0.161
2.3%
jan 1, 1971
7.327
+0.164
2.29%
jan 1, 1972
7.52
+0.192
2.63%
jan 1, 1973
7.692
+0.173
2.3%
jan 1, 1974
7.856
+0.164
2.13%
jan 1, 1975
8.028
+0.172
2.19%
jan 1, 1976
8.216
+0.188
2.34%
jan 1, 1977
8.416
+0.2
2.44%
jan 1, 1978
8.632
+0.216
2.57%
jan 1, 1979
8.829
+0.196
2.27%
jan 1, 1980
8.95
+0.122
1.38%
jan 1, 1981
8.974
+0.023
0.26%
jan 1, 1982
8.931
-0.043
-0.48%
jan 1, 1983
8.802
-0.128
-1.44%
jan 1, 1984
8.634
-0.168
-1.91%
jan 1, 1985
8.487
-0.147
-1.7%
jan 1, 1986
8.395
-0.093
-1.09%
jan 1, 1987
8.387
-0.008
-0.09%
jan 1, 1988
8.409
+0.022
0.27%
jan 1, 1989
8.471
+0.062
0.74%
jan 1, 1990
8.585
+0.113
1.34%
jan 1, 1991
8.757
+0.172
2.01%
jan 1, 1992
9.003
+0.246
2.81%
jan 1, 1993
9.305
+0.302
3.35%
jan 1, 1994
9.619
+0.314
3.37%
jan 1, 1995
9.881
+0.262
2.73%
jan 1, 1996
10.059
+0.178
1.8%
jan 1, 1997
10.225
+0.166
1.65%
jan 1, 1998
10.292
+0.067
0.65%
jan 1, 1999
10.315
+0.023
0.22%
jan 1, 2000
10.369
+0.054
0.53%
jan 1, 2001
10.489
+0.12
1.15%
jan 1, 2002
10.722
+0.233
2.22%
jan 1, 2003
11.01
+0.288
2.68%
jan 1, 2004
11.295
+0.285
2.59%
jan 1, 2005
11.479
+0.185
1.64%
jan 1, 2006
11.515
+0.036
0.31%
jan 1, 2007
11.533
+0.018
0.16%
jan 1, 2008
11.448
-0.086
-0.74%
jan 1, 2009
11.314
-0.134
-1.17%
jan 1, 2010
11.195
-0.119
-1.05%
jan 1, 2011
11.097
-0.097
-0.87%
jan 1, 2012
11.096
-0.001
-0.01%
jan 1, 2013
11.085
-0.011
-0.1%
jan 1, 2014
11.085
0.0
0.0%
jan 1, 2015
11.12
+0.034
0.31%
jan 1, 2016
11.193
+0.073
0.66%
Ranking of countries by current statistics by years


Comments: