29
/
en
AIzaSyAYiBZKx7MnpbEhh9jyipgxe19OcubqV5w
April 1, 2024
130958
Ethiopia
ETH
true
2
1
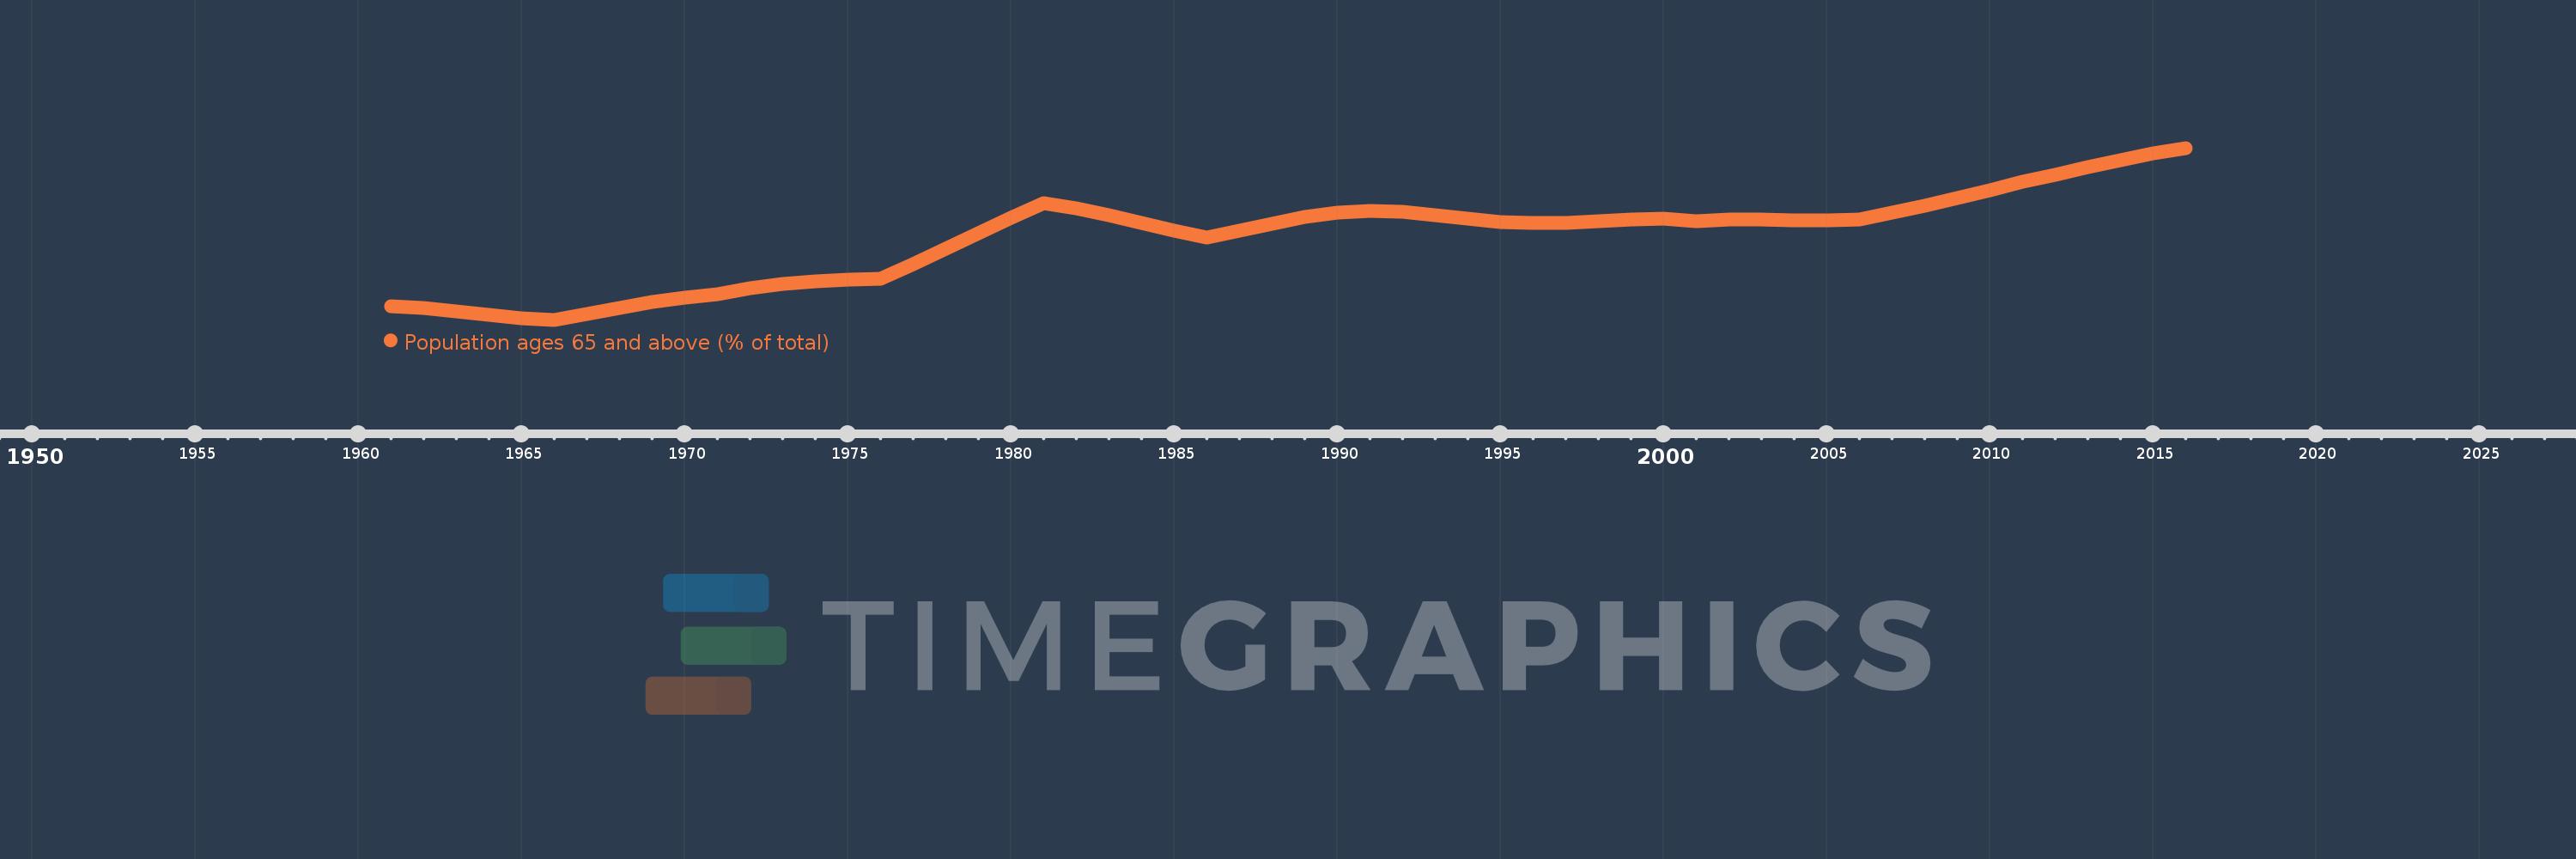
Population ages 65 and above (% of total)
2016,2015,2014,2013,2012,2011,2010,2009,2008,2007,2006,2005,2004,2003,2002,2001,2000,1999,1998,1997,1996,1995,1994,1993,1992,1991,1990,1989,1988,1987,1986,1985,1984,1983,1982,1981,1980,1979,1978,1977,1976,1975,1974,1973,1972,1971,1970,1969,1968,1967,1966,1965,1964,1963,1962,1961
This statistics in other country:
AfghanistanAlbaniaAlgeriaAngolaAntigua and BarbudaArab WorldArgentinaArmeniaArubaAustraliaAustriaAzerbaijanBahamas, TheBahrainBangladeshBarbadosBelarusBelgiumBelizeBeninBhutanBoliviaBosnia and HerzegovinaBotswanaBrazilBrunei DarussalamBulgariaBurkina FasoBurundiCabo VerdeCambodiaCameroonCanadaCaribbean small statesCentral African RepublicCentral Europe and the BalticsChadChannel IslandsChileChinaColombiaComorosCongo, Dem. Rep.Congo, Rep.Costa RicaCote d'IvoireCroatiaCubaCuracaoCyprusCzech RepublicDenmarkDjiboutiDominican RepublicEarly-demographic dividendEast Asia & PacificEast Asia & Pacific (excluding high income)East Asia & Pacific (IDA & IBRD countries)EcuadorEgypt, Arab Rep.El SalvadorEquatorial GuineaEritreaEstoniaEthiopiaEuro areaEurope & Central AsiaEurope & Central Asia (excluding high income)Europe & Central Asia (IDA & IBRD countries)European UnionFijiFinlandFragile and conflict affected situationsFranceFrench PolynesiaGabonGambia, TheGeorgiaGermanyGhanaGreeceGrenadaGuamGuatemalaGuineaGuinea-BissauGuyanaHaitiHeavily indebted poor countries (HIPC)High incomeHondurasHong Kong SAR, ChinaHungaryIBRD onlyIcelandIDA & IBRD totalIDA blendIDA onlyIDA totalIndiaIndonesiaIran, Islamic Rep.IraqIrelandIsraelItalyJamaicaJapanJordanKazakhstanKenyaKiribatiKorea, Dem. People’s Rep.Korea, Rep.KosovoKuwaitKyrgyz RepublicLao PDRLate-demographic dividendLatin America & Caribbean Latin America & Caribbean (excluding high income)Latin America & the Caribbean (IDA & IBRD countries)LatviaLeast developed countries: UN classificationLebanonLesothoLiberiaLibyaLithuaniaLow & middle incomeLow incomeLower middle incomeLuxembourgMacao SAR, ChinaMacedonia, FYRMadagascarMalawiMalaysiaMaldivesMaliMaltaMauritaniaMauritiusMexicoMicronesia, Fed. Sts.Middle East & North AfricaMiddle East & North Africa (excluding high income)Middle East & North Africa (IDA & IBRD countries)Middle incomeMoldovaMongoliaMontenegroMoroccoMozambiqueMyanmarNamibiaNepalNetherlandsNew CaledoniaNew ZealandNicaraguaNigerNigeriaNorth AmericaNorwayOECD membersOmanOther small statesPacific island small statesPakistanPanamaPapua New GuineaParaguayPeruPhilippinesPolandPortugalPost-demographic dividendPre-demographic dividendPuerto RicoQatarRomaniaRussian FederationRwandaSamoaSao Tome and PrincipeSaudi ArabiaSenegalSerbiaSeychellesSierra LeoneSingaporeSlovak RepublicSloveniaSmall statesSolomon IslandsSomaliaSouth AfricaSouth AsiaSouth Asia (IDA & IBRD)South SudanSpainSri LankaSt. LuciaSt. Vincent and the GrenadinesSub-Saharan Africa Sub-Saharan Africa (excluding high income)Sub-Saharan Africa (IDA & IBRD countries)SudanSurinameSwazilandSwedenSwitzerlandSyrian Arab RepublicTajikistanTanzaniaThailandTimor-LesteTogoTongaTrinidad and TobagoTunisiaTurkeyTurkmenistanUgandaUkraineUnited Arab EmiratesUnited KingdomUnited StatesUpper middle incomeUruguayUzbekistanVanuatuVenezuela, RBVietnamVirgin Islands (U.S.)West Bank and GazaWorldYemen, Rep.ZambiaZimbabwe Timeline:
This timeline shows a graph from 1961 to 2016 of Ethiopia. No data until 1960. Number of actual observations by date: 56.
Source name:
World Development Indicators
Source organization:
World Bank staff estimates based on age distributions of United Nations Population Division's World Population Prospects.
Categories, topics:
Health
Last updated:
apr 23, 2017
Indicators value changes by year
At the date of observation
Value
Absolute change
Change from previous value
jan 1, 1961
2.64
+2.64
0.0%
jan 1, 1962
2.632
-0.008
-0.32%
jan 1, 1963
2.613
-0.018
-0.7%
jan 1, 1964
2.592
-0.022
-0.83%
jan 1, 1965
2.575
-0.017
-0.65%
jan 1, 1966
2.567
-0.008
-0.32%
jan 1, 1967
2.596
+0.029
1.14%
jan 1, 1968
2.629
+0.033
1.29%
jan 1, 1969
2.662
+0.032
1.24%
jan 1, 1970
2.687
+0.025
0.95%
jan 1, 1971
2.702
+0.015
0.57%
jan 1, 1972
2.735
+0.033
1.23%
jan 1, 1973
2.757
+0.022
0.8%
jan 1, 1974
2.77
+0.013
0.48%
jan 1, 1975
2.779
+0.009
0.31%
jan 1, 1976
2.786
+0.007
0.24%
jan 1, 1977
2.863
+0.078
2.79%
jan 1, 1978
2.944
+0.081
2.82%
jan 1, 1979
3.029
+0.085
2.88%
jan 1, 1980
3.112
+0.083
2.75%
jan 1, 1981
3.187
+0.075
2.4%
jan 1, 1982
3.163
-0.023
-0.73%
jan 1, 1983
3.127
-0.037
-1.16%
jan 1, 1984
3.084
-0.043
-1.37%
jan 1, 1985
3.043
-0.041
-1.33%
jan 1, 1986
3.006
-0.037
-1.2%
jan 1, 1987
3.043
+0.037
1.21%
jan 1, 1988
3.081
+0.039
1.28%
jan 1, 1989
3.116
+0.034
1.12%
jan 1, 1990
3.139
+0.023
0.75%
jan 1, 1991
3.15
+0.011
0.34%
jan 1, 1992
3.144
-0.005
-0.17%
jan 1, 1993
3.127
-0.017
-0.55%
jan 1, 1994
3.105
-0.022
-0.72%
jan 1, 1995
3.088
-0.017
-0.54%
jan 1, 1996
3.083
-0.004
-0.14%
jan 1, 1997
3.086
+0.003
0.09%
jan 1, 1998
3.095
+0.009
0.3%
jan 1, 1999
3.104
+0.009
0.28%
jan 1, 2000
3.105
+0.0
0.01%
jan 1, 2001
3.094
-0.01
-0.34%
jan 1, 2002
3.1
+0.006
0.2%
jan 1, 2004
3.098
-0.003
-0.09%
jan 1, 2005
3.097
-0.001
-0.03%
jan 1, 2006
3.1
+0.003
0.11%
jan 1, 2007
3.138
+0.038
1.21%
jan 1, 2008
3.176
+0.038
1.22%
jan 1, 2009
3.215
+0.039
1.24%
jan 1, 2010
3.257
+0.042
1.3%
jan 1, 2011
3.302
+0.045
1.38%
jan 1, 2012
3.341
+0.039
1.18%
jan 1, 2013
3.38
+0.039
1.18%
jan 1, 2014
3.419
+0.038
1.13%
jan 1, 2015
3.453
+0.035
1.02%
jan 1, 2016
3.484
+0.031
0.88%
Ranking of countries by current statistics by years


Comments: