29
/
en
AIzaSyAYiBZKx7MnpbEhh9jyipgxe19OcubqV5w
April 1, 2024
255616
Swaziland
SWZ
true
2
1
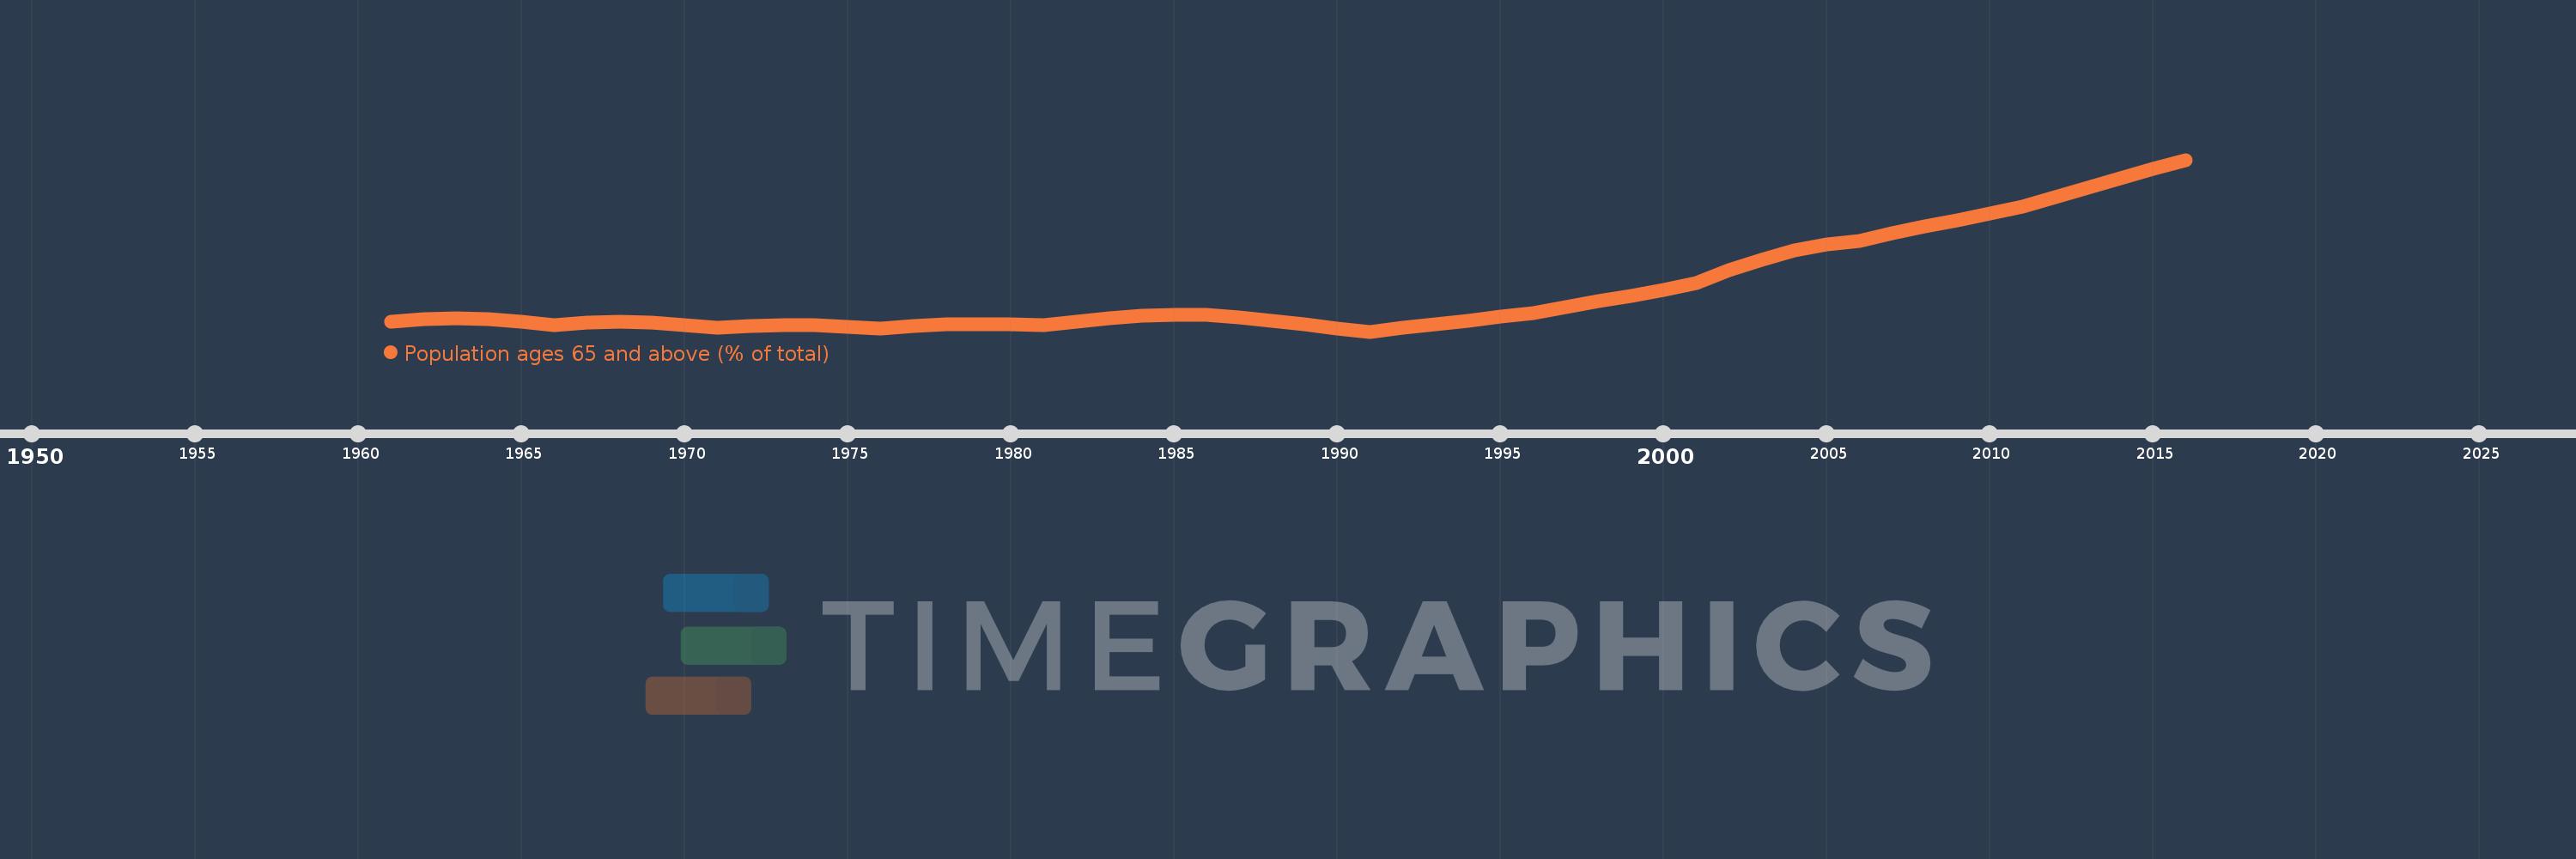
Population ages 65 and above (% of total)
2016,2015,2014,2013,2012,2011,2010,2009,2008,2007,2006,2005,2004,2003,2002,2001,2000,1999,1998,1997,1996,1995,1994,1993,1992,1991,1990,1989,1988,1987,1986,1985,1984,1983,1982,1981,1980,1979,1978,1977,1976,1975,1974,1973,1972,1971,1970,1969,1968,1967,1966,1965,1964,1963,1962,1961
This statistics in other country:
AfghanistanAlbaniaAlgeriaAngolaAntigua and BarbudaArab WorldArgentinaArmeniaArubaAustraliaAustriaAzerbaijanBahamas, TheBahrainBangladeshBarbadosBelarusBelgiumBelizeBeninBhutanBoliviaBosnia and HerzegovinaBotswanaBrazilBrunei DarussalamBulgariaBurkina FasoBurundiCabo VerdeCambodiaCameroonCanadaCaribbean small statesCentral African RepublicCentral Europe and the BalticsChadChannel IslandsChileChinaColombiaComorosCongo, Dem. Rep.Congo, Rep.Costa RicaCote d'IvoireCroatiaCubaCuracaoCyprusCzech RepublicDenmarkDjiboutiDominican RepublicEarly-demographic dividendEast Asia & PacificEast Asia & Pacific (excluding high income)East Asia & Pacific (IDA & IBRD countries)EcuadorEgypt, Arab Rep.El SalvadorEquatorial GuineaEritreaEstoniaEthiopiaEuro areaEurope & Central AsiaEurope & Central Asia (excluding high income)Europe & Central Asia (IDA & IBRD countries)European UnionFijiFinlandFragile and conflict affected situationsFranceFrench PolynesiaGabonGambia, TheGeorgiaGermanyGhanaGreeceGrenadaGuamGuatemalaGuineaGuinea-BissauGuyanaHaitiHeavily indebted poor countries (HIPC)High incomeHondurasHong Kong SAR, ChinaHungaryIBRD onlyIcelandIDA & IBRD totalIDA blendIDA onlyIDA totalIndiaIndonesiaIran, Islamic Rep.IraqIrelandIsraelItalyJamaicaJapanJordanKazakhstanKenyaKiribatiKorea, Dem. People’s Rep.Korea, Rep.KosovoKuwaitKyrgyz RepublicLao PDRLate-demographic dividendLatin America & Caribbean Latin America & Caribbean (excluding high income)Latin America & the Caribbean (IDA & IBRD countries)LatviaLeast developed countries: UN classificationLebanonLesothoLiberiaLibyaLithuaniaLow & middle incomeLow incomeLower middle incomeLuxembourgMacao SAR, ChinaMacedonia, FYRMadagascarMalawiMalaysiaMaldivesMaliMaltaMauritaniaMauritiusMexicoMicronesia, Fed. Sts.Middle East & North AfricaMiddle East & North Africa (excluding high income)Middle East & North Africa (IDA & IBRD countries)Middle incomeMoldovaMongoliaMontenegroMoroccoMozambiqueMyanmarNamibiaNepalNetherlandsNew CaledoniaNew ZealandNicaraguaNigerNigeriaNorth AmericaNorwayOECD membersOmanOther small statesPacific island small statesPakistanPanamaPapua New GuineaParaguayPeruPhilippinesPolandPortugalPost-demographic dividendPre-demographic dividendPuerto RicoQatarRomaniaRussian FederationRwandaSamoaSao Tome and PrincipeSaudi ArabiaSenegalSerbiaSeychellesSierra LeoneSingaporeSlovak RepublicSloveniaSmall statesSolomon IslandsSomaliaSouth AfricaSouth AsiaSouth Asia (IDA & IBRD)South SudanSpainSri LankaSt. LuciaSt. Vincent and the GrenadinesSub-Saharan Africa Sub-Saharan Africa (excluding high income)Sub-Saharan Africa (IDA & IBRD countries)SudanSurinameSwazilandSwedenSwitzerlandSyrian Arab RepublicTajikistanTanzaniaThailandTimor-LesteTogoTongaTrinidad and TobagoTunisiaTurkeyTurkmenistanUgandaUkraineUnited Arab EmiratesUnited KingdomUnited StatesUpper middle incomeUruguayUzbekistanVanuatuVenezuela, RBVietnamVirgin Islands (U.S.)West Bank and GazaWorldYemen, Rep.ZambiaZimbabwe Timeline:
This timeline shows a graph from 1961 to 2016 of Swaziland. No data until 1960. Number of actual observations by date: 56.
Source name:
World Development Indicators
Source organization:
World Bank staff estimates based on age distributions of United Nations Population Division's World Population Prospects.
Categories, topics:
Health
Last updated:
apr 23, 2017
Indicators value changes by year
At the date of observation
Value
Absolute change
Change from previous value
jan 1, 1961
2.747
+2.747
0.0%
jan 1, 1962
2.761
+0.014
0.5%
jan 1, 1963
2.765
+0.004
0.14%
jan 1, 1964
2.76
-0.004
-0.15%
jan 1, 1965
2.749
-0.011
-0.41%
jan 1, 1966
2.732
-0.017
-0.63%
jan 1, 1967
2.743
+0.011
0.41%
jan 1, 1968
2.747
+0.004
0.14%
jan 1, 1969
2.743
-0.004
-0.14%
jan 1, 1970
2.733
-0.01
-0.38%
jan 1, 1971
2.716
-0.016
-0.6%
jan 1, 1972
2.727
+0.011
0.4%
jan 1, 1973
2.732
+0.005
0.18%
jan 1, 1974
2.731
-0.001
-0.05%
jan 1, 1975
2.724
-0.007
-0.27%
jan 1, 1976
2.712
-0.011
-0.41%
jan 1, 1977
2.726
+0.014
0.5%
jan 1, 1978
2.734
+0.008
0.29%
jan 1, 1979
2.737
+0.003
0.11%
jan 1, 1980
2.735
-0.002
-0.08%
jan 1, 1981
2.729
-0.006
-0.2%
jan 1, 1982
2.75
+0.021
0.77%
jan 1, 1983
2.766
+0.016
0.59%
jan 1, 1984
2.778
+0.012
0.42%
jan 1, 1985
2.784
+0.006
0.2%
jan 1, 1986
2.783
-0.001
-0.03%
jan 1, 1987
2.77
-0.013
-0.45%
jan 1, 1988
2.753
-0.017
-0.6%
jan 1, 1989
2.734
-0.019
-0.7%
jan 1, 1990
2.715
-0.019
-0.71%
jan 1, 1991
2.698
-0.017
-0.61%
jan 1, 1992
2.718
+0.019
0.72%
jan 1, 1993
2.736
+0.019
0.69%
jan 1, 1994
2.755
+0.019
0.69%
jan 1, 1995
2.775
+0.02
0.71%
jan 1, 1996
2.795
+0.021
0.74%
jan 1, 1997
2.825
+0.03
1.06%
jan 1, 1998
2.853
+0.028
0.99%
jan 1, 1999
2.882
+0.028
1.0%
jan 1, 2000
2.913
+0.032
1.1%
jan 1, 2001
2.95
+0.036
1.25%
jan 1, 2002
3.013
+0.064
2.16%
jan 1, 2003
3.069
+0.056
1.86%
jan 1, 2004
3.116
+0.046
1.5%
jan 1, 2005
3.147
+0.032
1.02%
jan 1, 2006
3.163
+0.015
0.49%
jan 1, 2007
3.205
+0.042
1.33%
jan 1, 2008
3.241
+0.036
1.12%
jan 1, 2009
3.273
+0.032
0.99%
jan 1, 2010
3.305
+0.033
1.0%
jan 1, 2011
3.34
+0.035
1.06%
jan 1, 2012
3.389
+0.049
1.46%
jan 1, 2013
3.438
+0.049
1.45%
jan 1, 2014
3.487
+0.049
1.42%
jan 1, 2015
3.535
+0.048
1.38%
jan 1, 2016
3.583
+0.048
1.34%
Ranking of countries by current statistics by years


Comments: