29
/
en
AIzaSyAYiBZKx7MnpbEhh9jyipgxe19OcubqV5w
April 1, 2024
147263
Guinea-Bissau
GNB
true
2
1
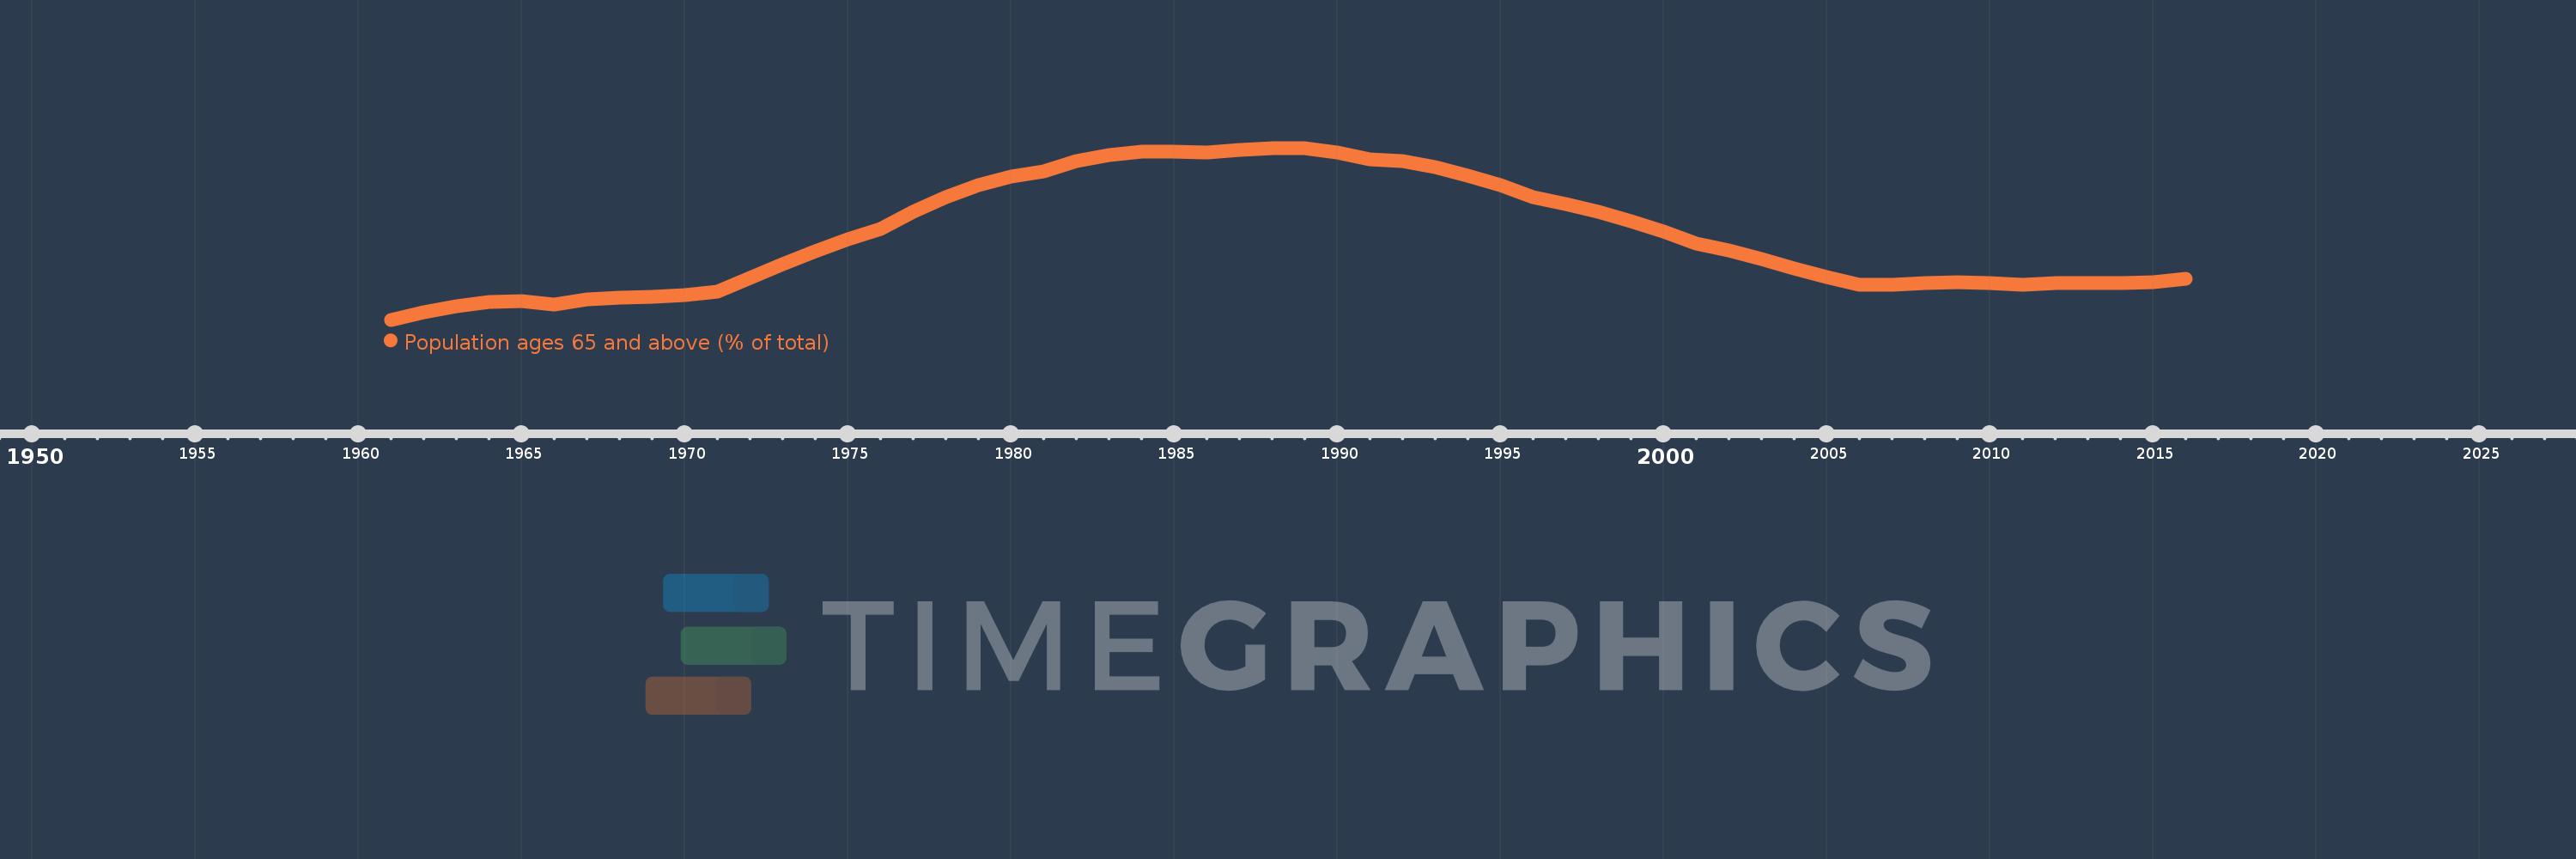
Population ages 65 and above (% of total)
2016,2015,2014,2013,2012,2011,2010,2009,2008,2007,2006,2005,2004,2003,2002,2001,2000,1999,1998,1997,1996,1995,1994,1993,1992,1991,1990,1989,1988,1987,1986,1985,1984,1983,1982,1981,1980,1979,1978,1977,1976,1975,1974,1973,1972,1971,1970,1969,1968,1967,1966,1965,1964,1963,1962,1961
This statistics in other country:
AfghanistanAlbaniaAlgeriaAngolaAntigua and BarbudaArab WorldArgentinaArmeniaArubaAustraliaAustriaAzerbaijanBahamas, TheBahrainBangladeshBarbadosBelarusBelgiumBelizeBeninBhutanBoliviaBosnia and HerzegovinaBotswanaBrazilBrunei DarussalamBulgariaBurkina FasoBurundiCabo VerdeCambodiaCameroonCanadaCaribbean small statesCentral African RepublicCentral Europe and the BalticsChadChannel IslandsChileChinaColombiaComorosCongo, Dem. Rep.Congo, Rep.Costa RicaCote d'IvoireCroatiaCubaCuracaoCyprusCzech RepublicDenmarkDjiboutiDominican RepublicEarly-demographic dividendEast Asia & PacificEast Asia & Pacific (excluding high income)East Asia & Pacific (IDA & IBRD countries)EcuadorEgypt, Arab Rep.El SalvadorEquatorial GuineaEritreaEstoniaEthiopiaEuro areaEurope & Central AsiaEurope & Central Asia (excluding high income)Europe & Central Asia (IDA & IBRD countries)European UnionFijiFinlandFragile and conflict affected situationsFranceFrench PolynesiaGabonGambia, TheGeorgiaGermanyGhanaGreeceGrenadaGuamGuatemalaGuineaGuinea-BissauGuyanaHaitiHeavily indebted poor countries (HIPC)High incomeHondurasHong Kong SAR, ChinaHungaryIBRD onlyIcelandIDA & IBRD totalIDA blendIDA onlyIDA totalIndiaIndonesiaIran, Islamic Rep.IraqIrelandIsraelItalyJamaicaJapanJordanKazakhstanKenyaKiribatiKorea, Dem. People’s Rep.Korea, Rep.KosovoKuwaitKyrgyz RepublicLao PDRLate-demographic dividendLatin America & Caribbean Latin America & Caribbean (excluding high income)Latin America & the Caribbean (IDA & IBRD countries)LatviaLeast developed countries: UN classificationLebanonLesothoLiberiaLibyaLithuaniaLow & middle incomeLow incomeLower middle incomeLuxembourgMacao SAR, ChinaMacedonia, FYRMadagascarMalawiMalaysiaMaldivesMaliMaltaMauritaniaMauritiusMexicoMicronesia, Fed. Sts.Middle East & North AfricaMiddle East & North Africa (excluding high income)Middle East & North Africa (IDA & IBRD countries)Middle incomeMoldovaMongoliaMontenegroMoroccoMozambiqueMyanmarNamibiaNepalNetherlandsNew CaledoniaNew ZealandNicaraguaNigerNigeriaNorth AmericaNorwayOECD membersOmanOther small statesPacific island small statesPakistanPanamaPapua New GuineaParaguayPeruPhilippinesPolandPortugalPost-demographic dividendPre-demographic dividendPuerto RicoQatarRomaniaRussian FederationRwandaSamoaSao Tome and PrincipeSaudi ArabiaSenegalSerbiaSeychellesSierra LeoneSingaporeSlovak RepublicSloveniaSmall statesSolomon IslandsSomaliaSouth AfricaSouth AsiaSouth Asia (IDA & IBRD)South SudanSpainSri LankaSt. LuciaSt. Vincent and the GrenadinesSub-Saharan Africa Sub-Saharan Africa (excluding high income)Sub-Saharan Africa (IDA & IBRD countries)SudanSurinameSwazilandSwedenSwitzerlandSyrian Arab RepublicTajikistanTanzaniaThailandTimor-LesteTogoTongaTrinidad and TobagoTunisiaTurkeyTurkmenistanUgandaUkraineUnited Arab EmiratesUnited KingdomUnited StatesUpper middle incomeUruguayUzbekistanVanuatuVenezuela, RBVietnamVirgin Islands (U.S.)West Bank and GazaWorldYemen, Rep.ZambiaZimbabwe Timeline:
This timeline shows a graph from 1961 to 2016 of Guinea-Bissau. No data until 1960. Number of actual observations by date: 56.
Source name:
World Development Indicators
Source organization:
World Bank staff estimates based on age distributions of United Nations Population Division's World Population Prospects.
Categories, topics:
Health
Last updated:
apr 23, 2017
Indicators value changes by year
At the date of observation
Value
Absolute change
Change from previous value
jan 1, 1961
2.929
+2.929
0.0%
jan 1, 1962
2.972
+0.043
1.46%
jan 1, 1963
3.008
+0.036
1.22%
jan 1, 1964
3.032
+0.024
0.8%
jan 1, 1965
3.036
+0.004
0.14%
jan 1, 1966
3.018
-0.018
-0.59%
jan 1, 1967
3.045
+0.027
0.88%
jan 1, 1968
3.056
+0.011
0.35%
jan 1, 1969
3.06
+0.004
0.14%
jan 1, 1970
3.069
+0.01
0.32%
jan 1, 1971
3.09
+0.021
0.69%
jan 1, 1972
3.169
+0.079
2.54%
jan 1, 1973
3.248
+0.079
2.49%
jan 1, 1974
3.324
+0.076
2.34%
jan 1, 1975
3.393
+0.069
2.08%
jan 1, 1976
3.454
+0.061
1.8%
jan 1, 1977
3.551
+0.097
2.79%
jan 1, 1978
3.635
+0.084
2.37%
jan 1, 1979
3.704
+0.069
1.9%
jan 1, 1980
3.755
+0.051
1.37%
jan 1, 1981
3.786
+0.031
0.82%
jan 1, 1982
3.845
+0.059
1.56%
jan 1, 1983
3.881
+0.036
0.94%
jan 1, 1984
3.898
+0.017
0.45%
jan 1, 1985
3.902
+0.003
0.09%
jan 1, 1986
3.895
-0.007
-0.18%
jan 1, 1987
3.912
+0.017
0.44%
jan 1, 1988
3.921
+0.009
0.24%
jan 1, 1989
3.919
-0.003
-0.07%
jan 1, 1990
3.897
-0.021
-0.54%
jan 1, 1991
3.856
-0.041
-1.06%
jan 1, 1992
3.843
-0.013
-0.35%
jan 1, 1993
3.81
-0.033
-0.86%
jan 1, 1994
3.762
-0.048
-1.26%
jan 1, 1995
3.704
-0.058
-1.55%
jan 1, 1996
3.638
-0.065
-1.77%
jan 1, 1997
3.598
-0.04
-1.09%
jan 1, 1998
3.552
-0.046
-1.28%
jan 1, 1999
3.499
-0.053
-1.49%
jan 1, 2000
3.438
-0.062
-1.77%
jan 1, 2001
3.367
-0.07
-2.04%
jan 1, 2002
3.328
-0.039
-1.17%
jan 1, 2003
3.278
-0.05
-1.49%
jan 1, 2004
3.224
-0.054
-1.64%
jan 1, 2005
3.174
-0.051
-1.57%
jan 1, 2006
3.13
-0.044
-1.37%
jan 1, 2007
3.133
+0.003
0.1%
jan 1, 2008
3.14
+0.007
0.21%
jan 1, 2009
3.145
+0.005
0.17%
jan 1, 2010
3.143
-0.002
-0.08%
jan 1, 2011
3.13
-0.013
-0.41%
jan 1, 2012
3.142
+0.012
0.38%
jan 1, 2013
3.142
+0.001
0.02%
jan 1, 2014
3.141
-0.002
-0.05%
jan 1, 2015
3.148
+0.007
0.22%
jan 1, 2016
3.168
+0.021
0.66%
Ranking of countries by current statistics by years


Comments: