29
/
en
AIzaSyAYiBZKx7MnpbEhh9jyipgxe19OcubqV5w
April 1, 2024
34529
Fragile and conflict affected situations
FCS
false
2
1
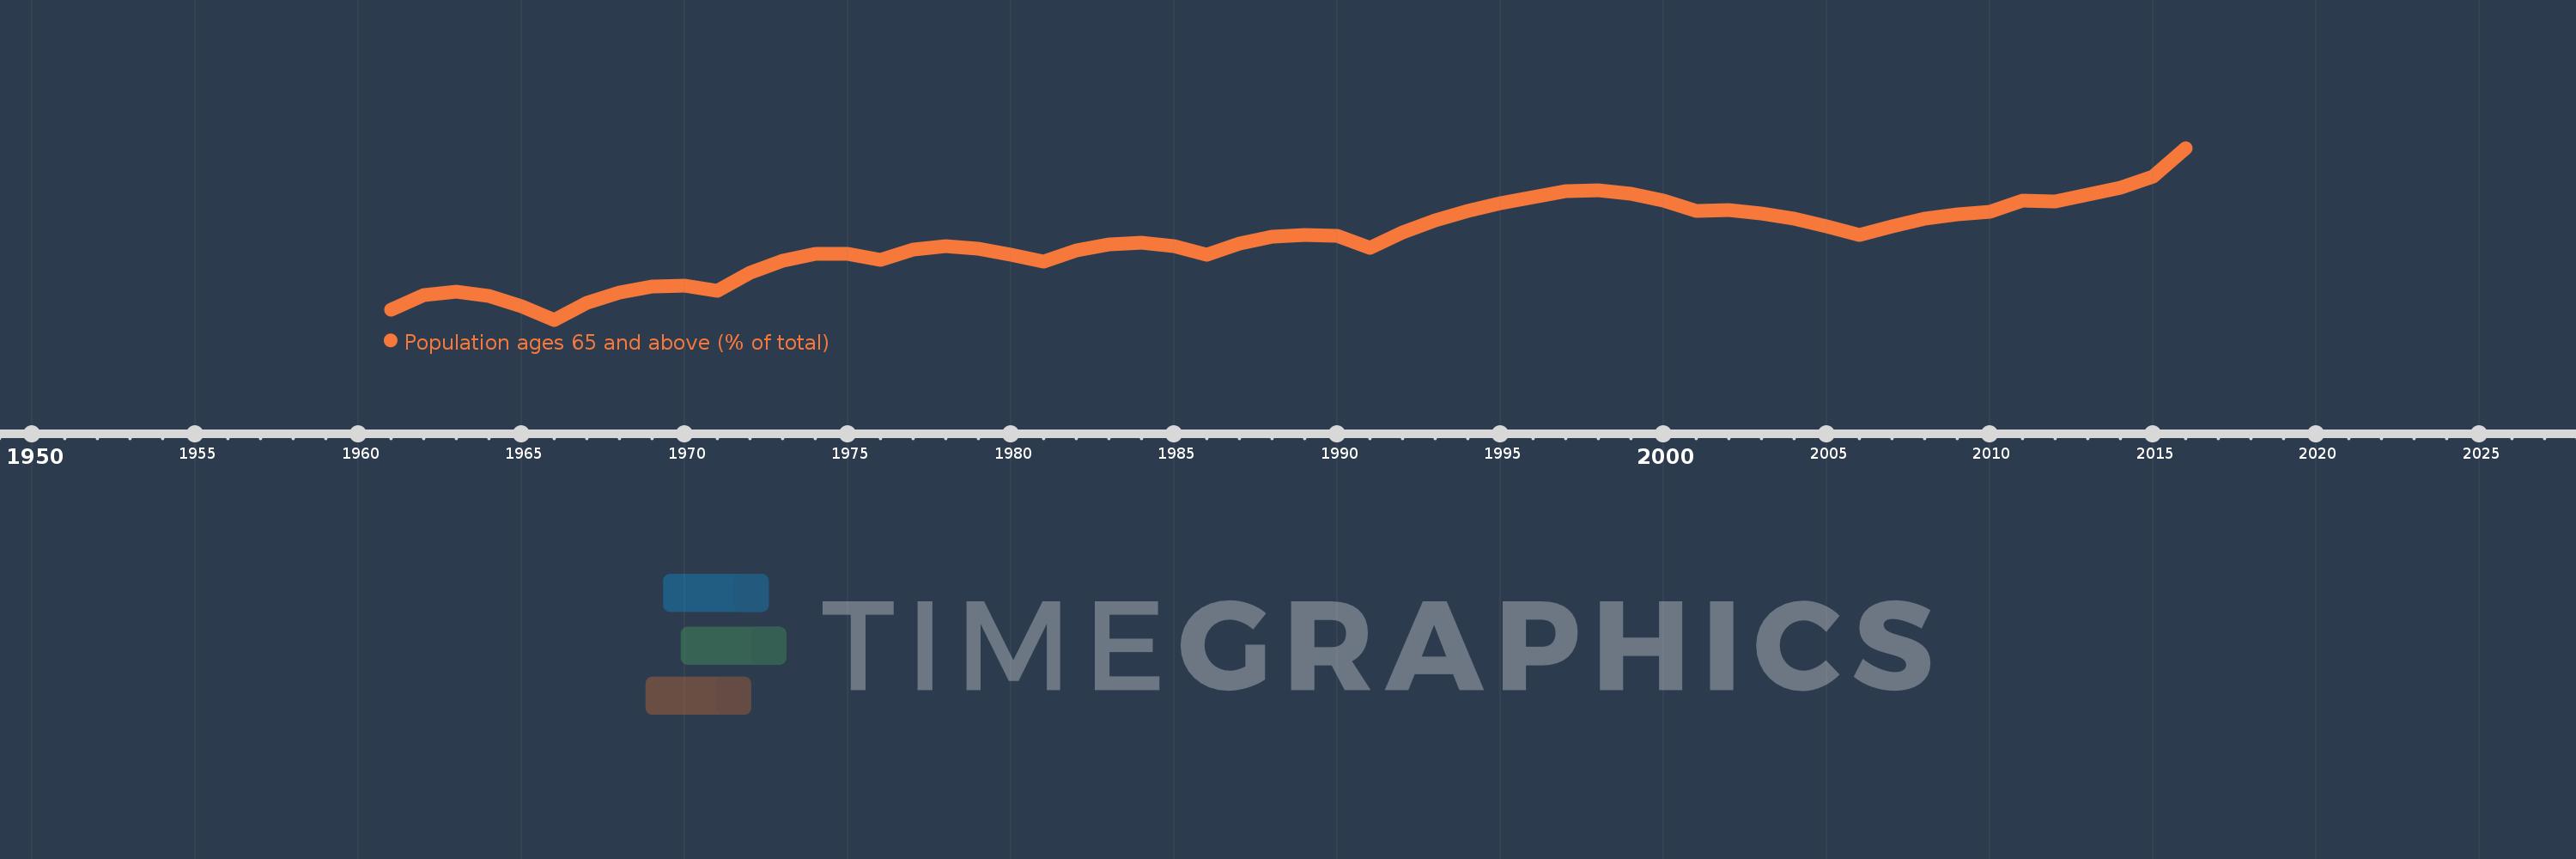
Population ages 65 and above (% of total)
2016,2015,2014,2013,2012,2011,2010,2009,2008,2007,2006,2005,2004,2003,2002,2001,2000,1999,1998,1997,1996,1995,1994,1993,1992,1991,1990,1989,1988,1987,1986,1985,1984,1983,1982,1981,1980,1979,1978,1977,1976,1975,1974,1973,1972,1971,1970,1969,1968,1967,1966,1965,1964,1963,1962,1961
This statistics in other country:
AfghanistanAlbaniaAlgeriaAngolaAntigua and BarbudaArab WorldArgentinaArmeniaArubaAustraliaAustriaAzerbaijanBahamas, TheBahrainBangladeshBarbadosBelarusBelgiumBelizeBeninBhutanBoliviaBosnia and HerzegovinaBotswanaBrazilBrunei DarussalamBulgariaBurkina FasoBurundiCabo VerdeCambodiaCameroonCanadaCaribbean small statesCentral African RepublicCentral Europe and the BalticsChadChannel IslandsChileChinaColombiaComorosCongo, Dem. Rep.Congo, Rep.Costa RicaCote d'IvoireCroatiaCubaCuracaoCyprusCzech RepublicDenmarkDjiboutiDominican RepublicEarly-demographic dividendEast Asia & PacificEast Asia & Pacific (excluding high income)East Asia & Pacific (IDA & IBRD countries)EcuadorEgypt, Arab Rep.El SalvadorEquatorial GuineaEritreaEstoniaEthiopiaEuro areaEurope & Central AsiaEurope & Central Asia (excluding high income)Europe & Central Asia (IDA & IBRD countries)European UnionFijiFinlandFragile and conflict affected situationsFranceFrench PolynesiaGabonGambia, TheGeorgiaGermanyGhanaGreeceGrenadaGuamGuatemalaGuineaGuinea-BissauGuyanaHaitiHeavily indebted poor countries (HIPC)High incomeHondurasHong Kong SAR, ChinaHungaryIBRD onlyIcelandIDA & IBRD totalIDA blendIDA onlyIDA totalIndiaIndonesiaIran, Islamic Rep.IraqIrelandIsraelItalyJamaicaJapanJordanKazakhstanKenyaKiribatiKorea, Dem. People’s Rep.Korea, Rep.KosovoKuwaitKyrgyz RepublicLao PDRLate-demographic dividendLatin America & Caribbean Latin America & Caribbean (excluding high income)Latin America & the Caribbean (IDA & IBRD countries)LatviaLeast developed countries: UN classificationLebanonLesothoLiberiaLibyaLithuaniaLow & middle incomeLow incomeLower middle incomeLuxembourgMacao SAR, ChinaMacedonia, FYRMadagascarMalawiMalaysiaMaldivesMaliMaltaMauritaniaMauritiusMexicoMicronesia, Fed. Sts.Middle East & North AfricaMiddle East & North Africa (excluding high income)Middle East & North Africa (IDA & IBRD countries)Middle incomeMoldovaMongoliaMontenegroMoroccoMozambiqueMyanmarNamibiaNepalNetherlandsNew CaledoniaNew ZealandNicaraguaNigerNigeriaNorth AmericaNorwayOECD membersOmanOther small statesPacific island small statesPakistanPanamaPapua New GuineaParaguayPeruPhilippinesPolandPortugalPost-demographic dividendPre-demographic dividendPuerto RicoQatarRomaniaRussian FederationRwandaSamoaSao Tome and PrincipeSaudi ArabiaSenegalSerbiaSeychellesSierra LeoneSingaporeSlovak RepublicSloveniaSmall statesSolomon IslandsSomaliaSouth AfricaSouth AsiaSouth Asia (IDA & IBRD)South SudanSpainSri LankaSt. LuciaSt. Vincent and the GrenadinesSub-Saharan Africa Sub-Saharan Africa (excluding high income)Sub-Saharan Africa (IDA & IBRD countries)SudanSurinameSwazilandSwedenSwitzerlandSyrian Arab RepublicTajikistanTanzaniaThailandTimor-LesteTogoTongaTrinidad and TobagoTunisiaTurkeyTurkmenistanUgandaUkraineUnited Arab EmiratesUnited KingdomUnited StatesUpper middle incomeUruguayUzbekistanVanuatuVenezuela, RBVietnamVirgin Islands (U.S.)West Bank and GazaWorldYemen, Rep.ZambiaZimbabwe Timeline:
This timeline shows a graph from 1961 to 2016 of Fragile and conflict affected situations. No data until 1960. Number of actual observations by date: 56.
Source name:
World Development Indicators
Source organization:
World Bank staff estimates based on age distributions of United Nations Population Division's World Population Prospects.
Categories, topics:
Health
Last updated:
apr 23, 2017
Indicators value changes by year
At the date of observation
Value
Absolute change
Change from previous value
jan 1, 1961
3.159
+3.159
0.0%
jan 1, 1962
3.177
+0.018
0.58%
jan 1, 1963
3.182
+0.005
0.14%
jan 1, 1964
3.176
-0.006
-0.19%
jan 1, 1965
3.163
-0.013
-0.39%
jan 1, 1966
3.146
-0.017
-0.54%
jan 1, 1967
3.167
+0.021
0.66%
jan 1, 1968
3.181
+0.014
0.44%
jan 1, 1969
3.188
+0.007
0.23%
jan 1, 1970
3.189
+0.0
0.01%
jan 1, 1971
3.183
-0.006
-0.19%
jan 1, 1972
3.206
+0.023
0.72%
jan 1, 1973
3.221
+0.016
0.5%
jan 1, 1974
3.23
+0.008
0.26%
jan 1, 1975
3.23
+0.0
0.01%
jan 1, 1976
3.222
-0.008
-0.25%
jan 1, 1977
3.235
+0.013
0.41%
jan 1, 1978
3.239
+0.004
0.12%
jan 1, 1979
3.236
-0.003
-0.1%
jan 1, 1980
3.229
-0.007
-0.22%
jan 1, 1981
3.22
-0.009
-0.27%
jan 1, 1982
3.234
+0.014
0.42%
jan 1, 1983
3.242
+0.008
0.24%
jan 1, 1984
3.244
+0.002
0.06%
jan 1, 1985
3.239
-0.005
-0.14%
jan 1, 1986
3.228
-0.011
-0.34%
jan 1, 1987
3.243
+0.015
0.45%
jan 1, 1988
3.251
+0.008
0.25%
jan 1, 1989
3.254
+0.003
0.08%
jan 1, 1990
3.252
-0.002
-0.06%
jan 1, 1991
3.237
-0.014
-0.44%
jan 1, 1992
3.257
+0.02
0.61%
jan 1, 1993
3.272
+0.015
0.47%
jan 1, 1994
3.284
+0.012
0.36%
jan 1, 1995
3.294
+0.009
0.28%
jan 1, 1996
3.301
+0.008
0.23%
jan 1, 1997
3.309
+0.007
0.21%
jan 1, 1998
3.31
+0.001
0.03%
jan 1, 1999
3.306
-0.004
-0.12%
jan 1, 2000
3.297
-0.009
-0.27%
jan 1, 2001
3.284
-0.013
-0.41%
jan 1, 2002
3.285
+0.001
0.04%
jan 1, 2003
3.281
-0.004
-0.11%
jan 1, 2004
3.274
-0.007
-0.22%
jan 1, 2005
3.264
-0.009
-0.29%
jan 1, 2006
3.254
-0.01
-0.31%
jan 1, 2007
3.265
+0.011
0.35%
jan 1, 2008
3.274
+0.009
0.27%
jan 1, 2009
3.28
+0.006
0.18%
jan 1, 2010
3.283
+0.003
0.08%
jan 1, 2011
3.297
+0.014
0.42%
jan 1, 2012
3.296
-0.001
-0.02%
jan 1, 2013
3.305
+0.009
0.27%
jan 1, 2014
3.313
+0.009
0.26%
jan 1, 2015
3.328
+0.015
0.44%
jan 1, 2016
3.364
+0.036
1.09%
Ranking of countries by current statistics by years


Comments: