29
/
en
AIzaSyAYiBZKx7MnpbEhh9jyipgxe19OcubqV5w
April 1, 2024
235030
Saudi Arabia
SAU
true
2
1
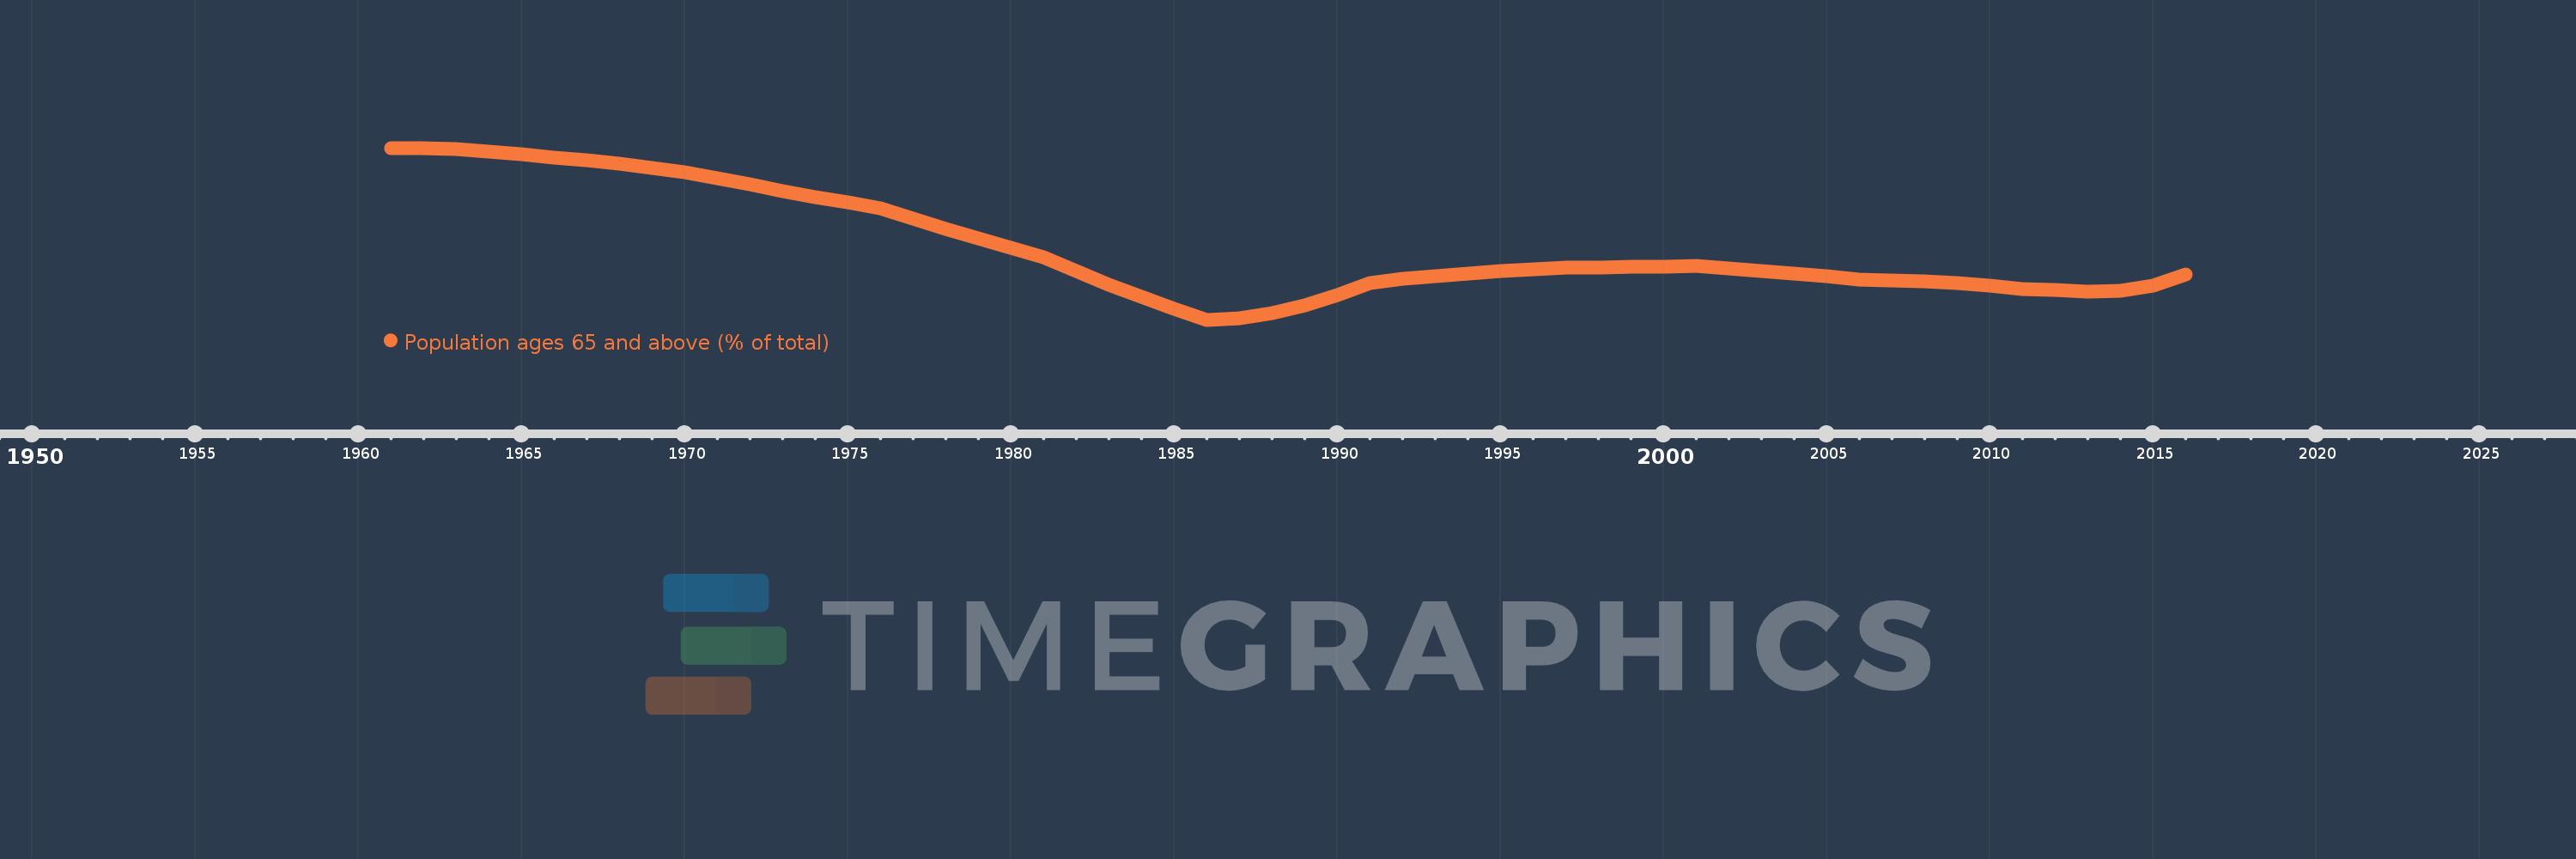
Population ages 65 and above (% of total)
2016,2015,2014,2013,2012,2011,2010,2009,2008,2007,2006,2005,2004,2003,2002,2001,2000,1999,1998,1997,1996,1995,1994,1993,1992,1991,1990,1989,1988,1987,1986,1985,1984,1983,1982,1981,1980,1979,1978,1977,1976,1975,1974,1973,1972,1971,1970,1969,1968,1967,1966,1965,1964,1963,1962,1961
This statistics in other country:
AfghanistanAlbaniaAlgeriaAngolaAntigua and BarbudaArab WorldArgentinaArmeniaArubaAustraliaAustriaAzerbaijanBahamas, TheBahrainBangladeshBarbadosBelarusBelgiumBelizeBeninBhutanBoliviaBosnia and HerzegovinaBotswanaBrazilBrunei DarussalamBulgariaBurkina FasoBurundiCabo VerdeCambodiaCameroonCanadaCaribbean small statesCentral African RepublicCentral Europe and the BalticsChadChannel IslandsChileChinaColombiaComorosCongo, Dem. Rep.Congo, Rep.Costa RicaCote d'IvoireCroatiaCubaCuracaoCyprusCzech RepublicDenmarkDjiboutiDominican RepublicEarly-demographic dividendEast Asia & PacificEast Asia & Pacific (excluding high income)East Asia & Pacific (IDA & IBRD countries)EcuadorEgypt, Arab Rep.El SalvadorEquatorial GuineaEritreaEstoniaEthiopiaEuro areaEurope & Central AsiaEurope & Central Asia (excluding high income)Europe & Central Asia (IDA & IBRD countries)European UnionFijiFinlandFragile and conflict affected situationsFranceFrench PolynesiaGabonGambia, TheGeorgiaGermanyGhanaGreeceGrenadaGuamGuatemalaGuineaGuinea-BissauGuyanaHaitiHeavily indebted poor countries (HIPC)High incomeHondurasHong Kong SAR, ChinaHungaryIBRD onlyIcelandIDA & IBRD totalIDA blendIDA onlyIDA totalIndiaIndonesiaIran, Islamic Rep.IraqIrelandIsraelItalyJamaicaJapanJordanKazakhstanKenyaKiribatiKorea, Dem. People’s Rep.Korea, Rep.KosovoKuwaitKyrgyz RepublicLao PDRLate-demographic dividendLatin America & Caribbean Latin America & Caribbean (excluding high income)Latin America & the Caribbean (IDA & IBRD countries)LatviaLeast developed countries: UN classificationLebanonLesothoLiberiaLibyaLithuaniaLow & middle incomeLow incomeLower middle incomeLuxembourgMacao SAR, ChinaMacedonia, FYRMadagascarMalawiMalaysiaMaldivesMaliMaltaMauritaniaMauritiusMexicoMicronesia, Fed. Sts.Middle East & North AfricaMiddle East & North Africa (excluding high income)Middle East & North Africa (IDA & IBRD countries)Middle incomeMoldovaMongoliaMontenegroMoroccoMozambiqueMyanmarNamibiaNepalNetherlandsNew CaledoniaNew ZealandNicaraguaNigerNigeriaNorth AmericaNorwayOECD membersOmanOther small statesPacific island small statesPakistanPanamaPapua New GuineaParaguayPeruPhilippinesPolandPortugalPost-demographic dividendPre-demographic dividendPuerto RicoQatarRomaniaRussian FederationRwandaSamoaSao Tome and PrincipeSaudi ArabiaSenegalSerbiaSeychellesSierra LeoneSingaporeSlovak RepublicSloveniaSmall statesSolomon IslandsSomaliaSouth AfricaSouth AsiaSouth Asia (IDA & IBRD)South SudanSpainSri LankaSt. LuciaSt. Vincent and the GrenadinesSub-Saharan Africa Sub-Saharan Africa (excluding high income)Sub-Saharan Africa (IDA & IBRD countries)SudanSurinameSwazilandSwedenSwitzerlandSyrian Arab RepublicTajikistanTanzaniaThailandTimor-LesteTogoTongaTrinidad and TobagoTunisiaTurkeyTurkmenistanUgandaUkraineUnited Arab EmiratesUnited KingdomUnited StatesUpper middle incomeUruguayUzbekistanVanuatuVenezuela, RBVietnamVirgin Islands (U.S.)West Bank and GazaWorldYemen, Rep.ZambiaZimbabwe Timeline:
This timeline shows a graph from 1961 to 2016 of Saudi Arabia. No data until 1960. Number of actual observations by date: 56.
Source name:
World Development Indicators
Source organization:
World Bank staff estimates based on age distributions of United Nations Population Division's World Population Prospects.
Categories, topics:
Health
Last updated:
apr 23, 2017
Indicators value changes by year
At the date of observation
Value
Absolute change
Change from previous value
jan 1, 1961
3.622
+3.622
0.0%
jan 1, 1962
3.621
0.0
-0.01%
jan 1, 1963
3.614
-0.007
-0.19%
jan 1, 1964
3.602
-0.013
-0.35%
jan 1, 1965
3.585
-0.017
-0.48%
jan 1, 1966
3.564
-0.02
-0.57%
jan 1, 1967
3.548
-0.016
-0.46%
jan 1, 1968
3.527
-0.021
-0.59%
jan 1, 1969
3.502
-0.025
-0.7%
jan 1, 1970
3.473
-0.029
-0.83%
jan 1, 1971
3.44
-0.033
-0.95%
jan 1, 1972
3.402
-0.038
-1.1%
jan 1, 1973
3.364
-0.039
-1.13%
jan 1, 1974
3.327
-0.037
-1.1%
jan 1, 1975
3.292
-0.035
-1.06%
jan 1, 1976
3.256
-0.035
-1.08%
jan 1, 1977
3.195
-0.061
-1.89%
jan 1, 1978
3.135
-0.06
-1.88%
jan 1, 1979
3.075
-0.059
-1.89%
jan 1, 1980
3.018
-0.058
-1.88%
jan 1, 1981
2.964
-0.053
-1.76%
jan 1, 1982
2.882
-0.083
-2.79%
jan 1, 1983
2.8
-0.082
-2.83%
jan 1, 1984
2.723
-0.077
-2.74%
jan 1, 1985
2.653
-0.071
-2.59%
jan 1, 1986
2.587
-0.066
-2.49%
jan 1, 1987
2.596
+0.01
0.38%
jan 1, 1988
2.625
+0.029
1.1%
jan 1, 1989
2.671
+0.047
1.77%
jan 1, 1990
2.733
+0.062
2.31%
jan 1, 1991
2.809
+0.076
2.76%
jan 1, 1992
2.832
+0.023
0.82%
jan 1, 1993
2.85
+0.018
0.63%
jan 1, 1994
2.866
+0.016
0.56%
jan 1, 1995
2.88
+0.015
0.52%
jan 1, 1996
2.893
+0.013
0.44%
jan 1, 1997
2.899
+0.006
0.2%
jan 1, 1998
2.901
+0.003
0.09%
jan 1, 1999
2.904
+0.002
0.08%
jan 1, 2000
2.907
+0.004
0.13%
jan 1, 2001
2.912
+0.005
0.17%
jan 1, 2002
2.896
-0.016
-0.56%
jan 1, 2003
2.88
-0.016
-0.54%
jan 1, 2004
2.864
-0.016
-0.55%
jan 1, 2005
2.847
-0.017
-0.6%
jan 1, 2006
2.829
-0.018
-0.64%
jan 1, 2007
2.825
-0.004
-0.14%
jan 1, 2008
2.819
-0.006
-0.2%
jan 1, 2009
2.81
-0.009
-0.33%
jan 1, 2010
2.794
-0.016
-0.57%
jan 1, 2011
2.77
-0.024
-0.85%
jan 1, 2012
2.764
-0.006
-0.23%
jan 1, 2013
2.758
-0.007
-0.24%
jan 1, 2014
2.763
+0.005
0.18%
jan 1, 2015
2.795
+0.032
1.16%
jan 1, 2016
2.862
+0.068
2.42%
Ranking of countries by current statistics by years


Comments: