29
/
en
AIzaSyAYiBZKx7MnpbEhh9jyipgxe19OcubqV5w
April 1, 2024
246107
South Africa
ZAF
true
2
1
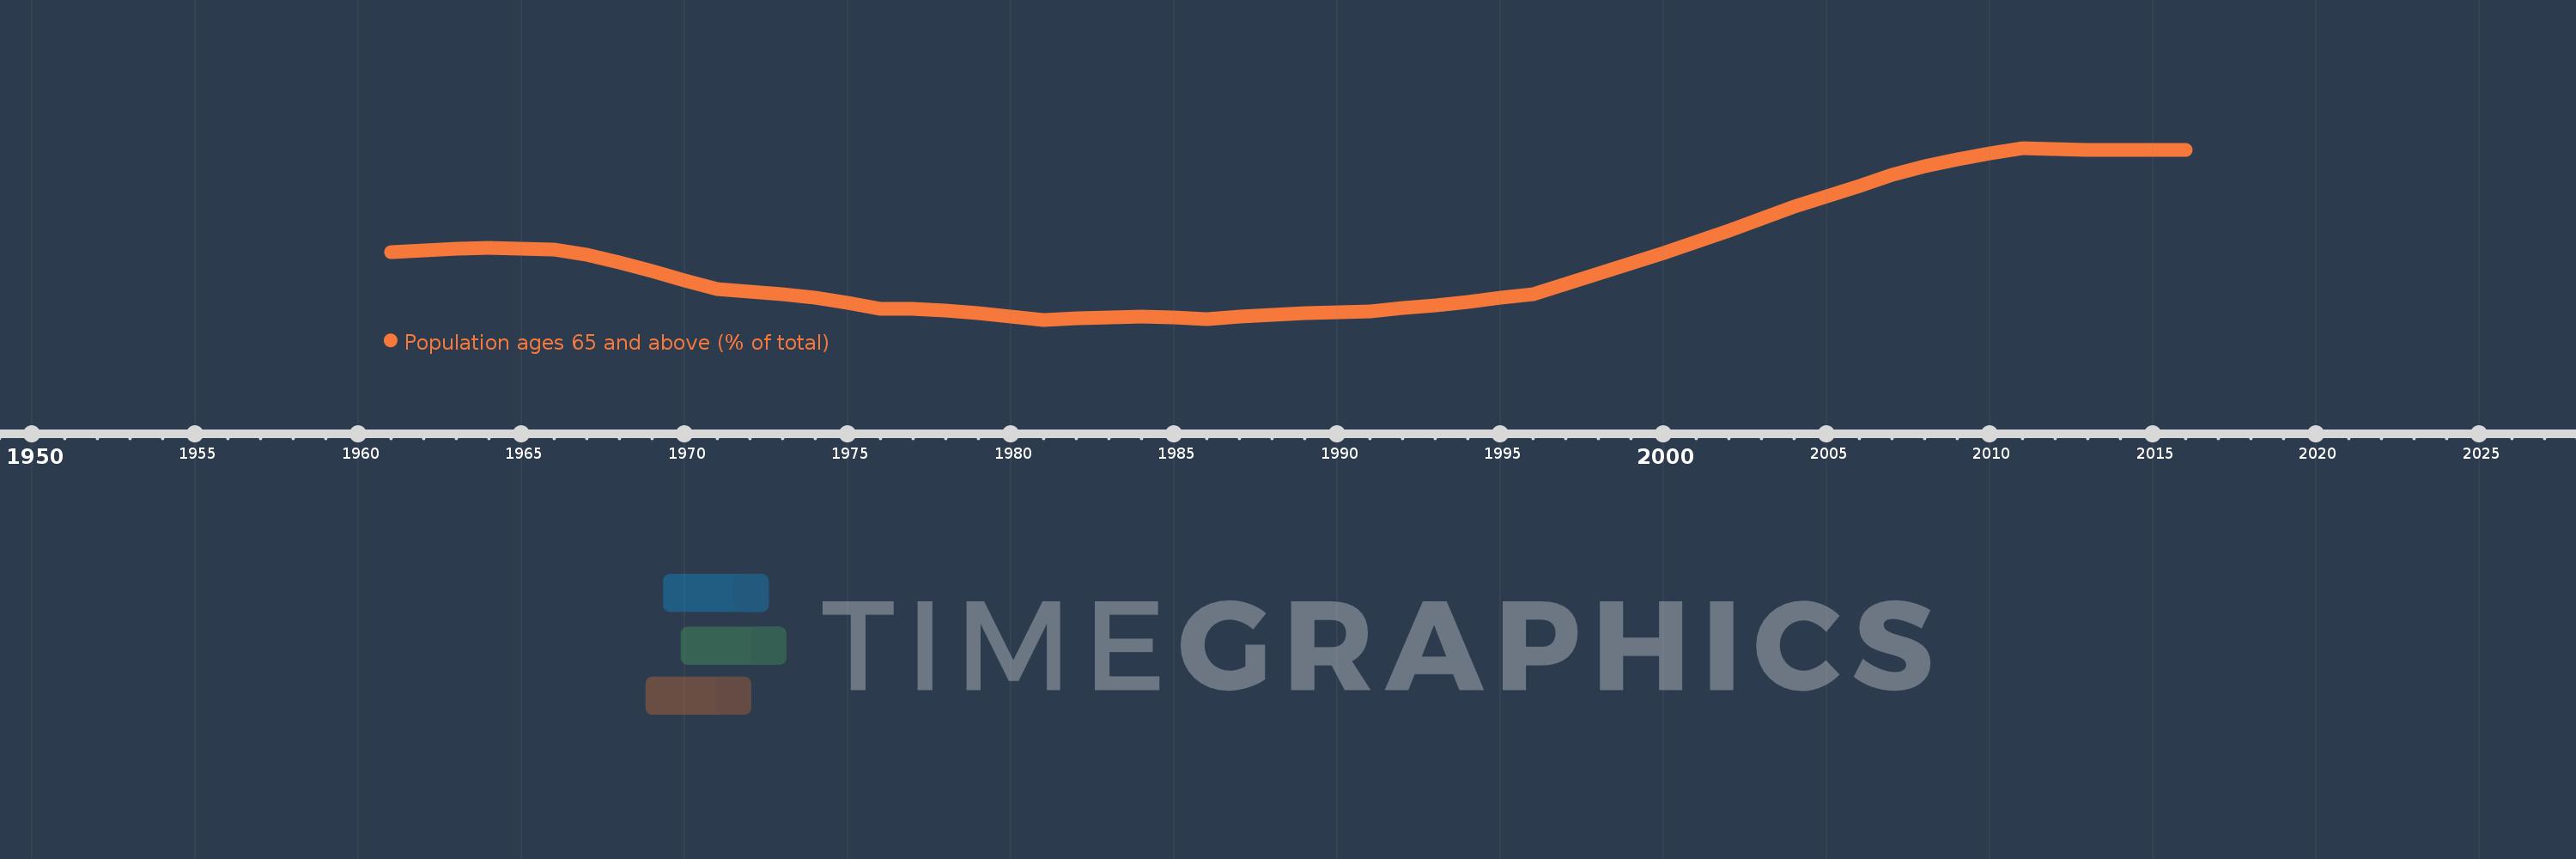
Population ages 65 and above (% of total)
2016,2015,2014,2013,2012,2011,2010,2009,2008,2007,2006,2005,2004,2003,2002,2001,2000,1999,1998,1997,1996,1995,1994,1993,1992,1991,1990,1989,1988,1987,1986,1985,1984,1983,1982,1981,1980,1979,1978,1977,1976,1975,1974,1973,1972,1971,1970,1969,1968,1967,1966,1965,1964,1963,1962,1961
This statistics in other country:
AfghanistanAlbaniaAlgeriaAngolaAntigua and BarbudaArab WorldArgentinaArmeniaArubaAustraliaAustriaAzerbaijanBahamas, TheBahrainBangladeshBarbadosBelarusBelgiumBelizeBeninBhutanBoliviaBosnia and HerzegovinaBotswanaBrazilBrunei DarussalamBulgariaBurkina FasoBurundiCabo VerdeCambodiaCameroonCanadaCaribbean small statesCentral African RepublicCentral Europe and the BalticsChadChannel IslandsChileChinaColombiaComorosCongo, Dem. Rep.Congo, Rep.Costa RicaCote d'IvoireCroatiaCubaCuracaoCyprusCzech RepublicDenmarkDjiboutiDominican RepublicEarly-demographic dividendEast Asia & PacificEast Asia & Pacific (excluding high income)East Asia & Pacific (IDA & IBRD countries)EcuadorEgypt, Arab Rep.El SalvadorEquatorial GuineaEritreaEstoniaEthiopiaEuro areaEurope & Central AsiaEurope & Central Asia (excluding high income)Europe & Central Asia (IDA & IBRD countries)European UnionFijiFinlandFragile and conflict affected situationsFranceFrench PolynesiaGabonGambia, TheGeorgiaGermanyGhanaGreeceGrenadaGuamGuatemalaGuineaGuinea-BissauGuyanaHaitiHeavily indebted poor countries (HIPC)High incomeHondurasHong Kong SAR, ChinaHungaryIBRD onlyIcelandIDA & IBRD totalIDA blendIDA onlyIDA totalIndiaIndonesiaIran, Islamic Rep.IraqIrelandIsraelItalyJamaicaJapanJordanKazakhstanKenyaKiribatiKorea, Dem. People’s Rep.Korea, Rep.KosovoKuwaitKyrgyz RepublicLao PDRLate-demographic dividendLatin America & Caribbean Latin America & Caribbean (excluding high income)Latin America & the Caribbean (IDA & IBRD countries)LatviaLeast developed countries: UN classificationLebanonLesothoLiberiaLibyaLithuaniaLow & middle incomeLow incomeLower middle incomeLuxembourgMacao SAR, ChinaMacedonia, FYRMadagascarMalawiMalaysiaMaldivesMaliMaltaMauritaniaMauritiusMexicoMicronesia, Fed. Sts.Middle East & North AfricaMiddle East & North Africa (excluding high income)Middle East & North Africa (IDA & IBRD countries)Middle incomeMoldovaMongoliaMontenegroMoroccoMozambiqueMyanmarNamibiaNepalNetherlandsNew CaledoniaNew ZealandNicaraguaNigerNigeriaNorth AmericaNorwayOECD membersOmanOther small statesPacific island small statesPakistanPanamaPapua New GuineaParaguayPeruPhilippinesPolandPortugalPost-demographic dividendPre-demographic dividendPuerto RicoQatarRomaniaRussian FederationRwandaSamoaSao Tome and PrincipeSaudi ArabiaSenegalSerbiaSeychellesSierra LeoneSingaporeSlovak RepublicSloveniaSmall statesSolomon IslandsSomaliaSouth AfricaSouth AsiaSouth Asia (IDA & IBRD)South SudanSpainSri LankaSt. LuciaSt. Vincent and the GrenadinesSub-Saharan Africa Sub-Saharan Africa (excluding high income)Sub-Saharan Africa (IDA & IBRD countries)SudanSurinameSwazilandSwedenSwitzerlandSyrian Arab RepublicTajikistanTanzaniaThailandTimor-LesteTogoTongaTrinidad and TobagoTunisiaTurkeyTurkmenistanUgandaUkraineUnited Arab EmiratesUnited KingdomUnited StatesUpper middle incomeUruguayUzbekistanVanuatuVenezuela, RBVietnamVirgin Islands (U.S.)West Bank and GazaWorldYemen, Rep.ZambiaZimbabwe Timeline:
This timeline shows a graph from 1961 to 2016 of South Africa. No data until 1960. Number of actual observations by date: 56.
Source name:
World Development Indicators
Source organization:
World Bank staff estimates based on age distributions of United Nations Population Division's World Population Prospects.
Categories, topics:
Health
Last updated:
apr 23, 2017
Indicators value changes by year
At the date of observation
Value
Absolute change
Change from previous value
jan 1, 1961
3.865
+3.865
0.0%
jan 1, 1962
3.89
+0.025
0.65%
jan 1, 1963
3.907
+0.017
0.43%
jan 1, 1964
3.914
+0.007
0.18%
jan 1, 1965
3.911
-0.003
-0.08%
jan 1, 1966
3.898
-0.013
-0.33%
jan 1, 1967
3.836
-0.062
-1.58%
jan 1, 1968
3.753
-0.083
-2.16%
jan 1, 1969
3.656
-0.097
-2.59%
jan 1, 1970
3.552
-0.104
-2.84%
jan 1, 1971
3.446
-0.106
-2.99%
jan 1, 1972
3.421
-0.025
-0.72%
jan 1, 1973
3.39
-0.031
-0.91%
jan 1, 1974
3.349
-0.041
-1.2%
jan 1, 1975
3.296
-0.053
-1.59%
jan 1, 1976
3.229
-0.066
-2.01%
jan 1, 1977
3.224
-0.005
-0.16%
jan 1, 1978
3.206
-0.018
-0.57%
jan 1, 1979
3.177
-0.029
-0.89%
jan 1, 1980
3.142
-0.035
-1.12%
jan 1, 1981
3.102
-0.04
-1.27%
jan 1, 1982
3.121
+0.019
0.61%
jan 1, 1983
3.132
+0.011
0.36%
jan 1, 1984
3.135
+0.003
0.08%
jan 1, 1985
3.128
-0.007
-0.21%
jan 1, 1986
3.113
-0.015
-0.48%
jan 1, 1987
3.141
+0.028
0.89%
jan 1, 1988
3.16
+0.02
0.63%
jan 1, 1989
3.174
+0.014
0.43%
jan 1, 1990
3.184
+0.01
0.32%
jan 1, 1991
3.193
+0.009
0.28%
jan 1, 1992
3.231
+0.038
1.18%
jan 1, 1993
3.269
+0.038
1.18%
jan 1, 1994
3.308
+0.039
1.19%
jan 1, 1995
3.348
+0.04
1.22%
jan 1, 1996
3.391
+0.043
1.28%
jan 1, 1997
3.509
+0.118
3.48%
jan 1, 1998
3.627
+0.117
3.35%
jan 1, 1999
3.744
+0.117
3.23%
jan 1, 2000
3.862
+0.118
3.15%
jan 1, 2001
3.981
+0.119
3.08%
jan 1, 2002
4.116
+0.135
3.38%
jan 1, 2003
4.25
+0.135
3.27%
jan 1, 2004
4.383
+0.133
3.13%
jan 1, 2005
4.507
+0.124
2.83%
jan 1, 2006
4.616
+0.109
2.41%
jan 1, 2007
4.745
+0.129
2.79%
jan 1, 2008
4.848
+0.103
2.16%
jan 1, 2009
4.926
+0.079
1.63%
jan 1, 2010
4.991
+0.065
1.31%
jan 1, 2011
5.051
+0.06
1.21%
jan 1, 2012
5.036
-0.015
-0.3%
jan 1, 2013
5.029
-0.007
-0.15%
jan 1, 2014
5.027
-0.002
-0.04%
jan 1, 2015
5.028
+0.001
0.02%
jan 1, 2016
5.033
+0.005
0.11%
Ranking of countries by current statistics by years


Comments: