29
/
en
AIzaSyAYiBZKx7MnpbEhh9jyipgxe19OcubqV5w
April 1, 2024
261402
Tanzania
TZA
true
2
1
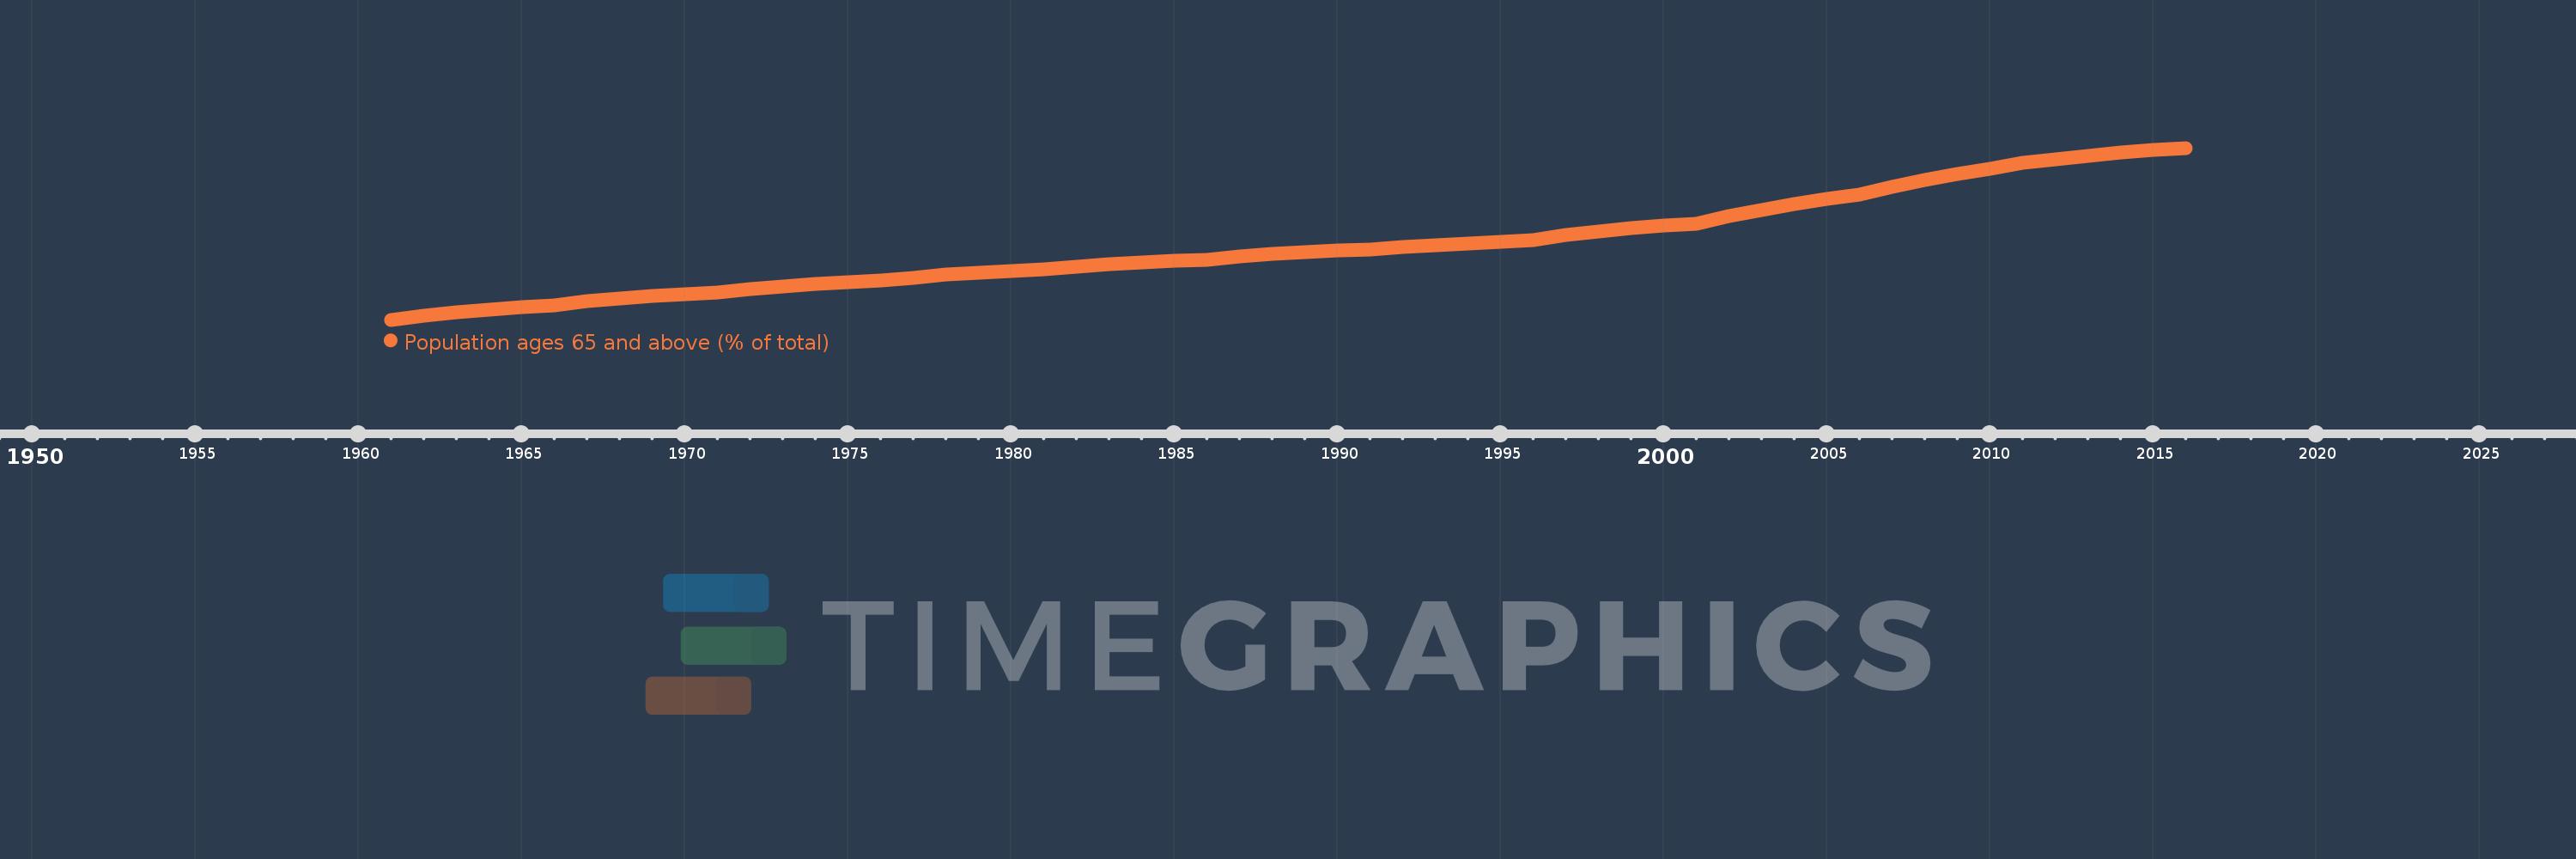
Population ages 65 and above (% of total)
2016,2015,2014,2013,2012,2011,2010,2009,2008,2007,2006,2005,2004,2003,2002,2001,2000,1999,1998,1997,1996,1995,1994,1993,1992,1991,1990,1989,1988,1987,1986,1985,1984,1983,1982,1981,1980,1979,1978,1977,1976,1975,1974,1973,1972,1971,1970,1969,1968,1967,1966,1965,1964,1963,1962,1961
This statistics in other country:
AfghanistanAlbaniaAlgeriaAngolaAntigua and BarbudaArab WorldArgentinaArmeniaArubaAustraliaAustriaAzerbaijanBahamas, TheBahrainBangladeshBarbadosBelarusBelgiumBelizeBeninBhutanBoliviaBosnia and HerzegovinaBotswanaBrazilBrunei DarussalamBulgariaBurkina FasoBurundiCabo VerdeCambodiaCameroonCanadaCaribbean small statesCentral African RepublicCentral Europe and the BalticsChadChannel IslandsChileChinaColombiaComorosCongo, Dem. Rep.Congo, Rep.Costa RicaCote d'IvoireCroatiaCubaCuracaoCyprusCzech RepublicDenmarkDjiboutiDominican RepublicEarly-demographic dividendEast Asia & PacificEast Asia & Pacific (excluding high income)East Asia & Pacific (IDA & IBRD countries)EcuadorEgypt, Arab Rep.El SalvadorEquatorial GuineaEritreaEstoniaEthiopiaEuro areaEurope & Central AsiaEurope & Central Asia (excluding high income)Europe & Central Asia (IDA & IBRD countries)European UnionFijiFinlandFragile and conflict affected situationsFranceFrench PolynesiaGabonGambia, TheGeorgiaGermanyGhanaGreeceGrenadaGuamGuatemalaGuineaGuinea-BissauGuyanaHaitiHeavily indebted poor countries (HIPC)High incomeHondurasHong Kong SAR, ChinaHungaryIBRD onlyIcelandIDA & IBRD totalIDA blendIDA onlyIDA totalIndiaIndonesiaIran, Islamic Rep.IraqIrelandIsraelItalyJamaicaJapanJordanKazakhstanKenyaKiribatiKorea, Dem. People’s Rep.Korea, Rep.KosovoKuwaitKyrgyz RepublicLao PDRLate-demographic dividendLatin America & Caribbean Latin America & Caribbean (excluding high income)Latin America & the Caribbean (IDA & IBRD countries)LatviaLeast developed countries: UN classificationLebanonLesothoLiberiaLibyaLithuaniaLow & middle incomeLow incomeLower middle incomeLuxembourgMacao SAR, ChinaMacedonia, FYRMadagascarMalawiMalaysiaMaldivesMaliMaltaMauritaniaMauritiusMexicoMicronesia, Fed. Sts.Middle East & North AfricaMiddle East & North Africa (excluding high income)Middle East & North Africa (IDA & IBRD countries)Middle incomeMoldovaMongoliaMontenegroMoroccoMozambiqueMyanmarNamibiaNepalNetherlandsNew CaledoniaNew ZealandNicaraguaNigerNigeriaNorth AmericaNorwayOECD membersOmanOther small statesPacific island small statesPakistanPanamaPapua New GuineaParaguayPeruPhilippinesPolandPortugalPost-demographic dividendPre-demographic dividendPuerto RicoQatarRomaniaRussian FederationRwandaSamoaSao Tome and PrincipeSaudi ArabiaSenegalSerbiaSeychellesSierra LeoneSingaporeSlovak RepublicSloveniaSmall statesSolomon IslandsSomaliaSouth AfricaSouth AsiaSouth Asia (IDA & IBRD)South SudanSpainSri LankaSt. LuciaSt. Vincent and the GrenadinesSub-Saharan Africa Sub-Saharan Africa (excluding high income)Sub-Saharan Africa (IDA & IBRD countries)SudanSurinameSwazilandSwedenSwitzerlandSyrian Arab RepublicTajikistanTanzaniaThailandTimor-LesteTogoTongaTrinidad and TobagoTunisiaTurkeyTurkmenistanUgandaUkraineUnited Arab EmiratesUnited KingdomUnited StatesUpper middle incomeUruguayUzbekistanVanuatuVenezuela, RBVietnamVirgin Islands (U.S.)West Bank and GazaWorldYemen, Rep.ZambiaZimbabwe Timeline:
This timeline shows a graph from 1961 to 2016 of Tanzania. No data until 1960. Number of actual observations by date: 56.
Source name:
World Development Indicators
Source organization:
World Bank staff estimates based on age distributions of United Nations Population Division's World Population Prospects.
Categories, topics:
Health
Last updated:
apr 23, 2017
Indicators value changes by year
At the date of observation
Value
Absolute change
Change from previous value
jan 1, 1961
2.375
+2.375
0.0%
jan 1, 1962
2.394
+0.019
0.79%
jan 1, 1963
2.411
+0.017
0.69%
jan 1, 1964
2.425
+0.014
0.58%
jan 1, 1965
2.436
+0.011
0.44%
jan 1, 1966
2.443
+0.007
0.3%
jan 1, 1967
2.463
+0.02
0.81%
jan 1, 1968
2.478
+0.015
0.62%
jan 1, 1969
2.489
+0.011
0.46%
jan 1, 1970
2.498
+0.009
0.35%
jan 1, 1971
2.505
+0.007
0.27%
jan 1, 1972
2.521
+0.016
0.66%
jan 1, 1973
2.535
+0.013
0.53%
jan 1, 1974
2.546
+0.011
0.43%
jan 1, 1975
2.554
+0.009
0.35%
jan 1, 1976
2.562
+0.008
0.29%
jan 1, 1977
2.578
+0.016
0.64%
jan 1, 1978
2.591
+0.013
0.49%
jan 1, 1979
2.601
+0.01
0.39%
jan 1, 1980
2.609
+0.008
0.31%
jan 1, 1981
2.616
+0.007
0.27%
jan 1, 1982
2.63
+0.014
0.53%
jan 1, 1983
2.642
+0.011
0.43%
jan 1, 1984
2.651
+0.009
0.35%
jan 1, 1985
2.659
+0.008
0.29%
jan 1, 1986
2.665
+0.006
0.24%
jan 1, 1987
2.68
+0.015
0.55%
jan 1, 1988
2.691
+0.011
0.42%
jan 1, 1989
2.699
+0.009
0.32%
jan 1, 1990
2.707
+0.007
0.26%
jan 1, 1991
2.712
+0.006
0.22%
jan 1, 1992
2.725
+0.012
0.45%
jan 1, 1993
2.734
+0.01
0.36%
jan 1, 1994
2.743
+0.008
0.3%
jan 1, 1995
2.751
+0.008
0.29%
jan 1, 1996
2.76
+0.009
0.32%
jan 1, 1997
2.782
+0.022
0.81%
jan 1, 1998
2.801
+0.019
0.69%
jan 1, 1999
2.817
+0.016
0.57%
jan 1, 2000
2.829
+0.012
0.41%
jan 1, 2001
2.835
+0.006
0.23%
jan 1, 2002
2.873
+0.037
1.32%
jan 1, 2003
2.904
+0.032
1.1%
jan 1, 2004
2.931
+0.027
0.93%
jan 1, 2005
2.956
+0.024
0.83%
jan 1, 2006
2.979
+0.023
0.79%
jan 1, 2007
3.014
+0.035
1.16%
jan 1, 2008
3.046
+0.032
1.06%
jan 1, 2009
3.075
+0.029
0.96%
jan 1, 2010
3.102
+0.027
0.89%
jan 1, 2011
3.129
+0.026
0.85%
jan 1, 2012
3.147
+0.018
0.57%
jan 1, 2013
3.165
+0.018
0.57%
jan 1, 2014
3.181
+0.016
0.51%
jan 1, 2015
3.193
+0.013
0.39%
jan 1, 2016
3.202
+0.009
0.28%
Ranking of countries by current statistics by years


Comments: