29
/
en
AIzaSyAYiBZKx7MnpbEhh9jyipgxe19OcubqV5w
April 1, 2024
104459
Channel Islands
CHI
true
2
1
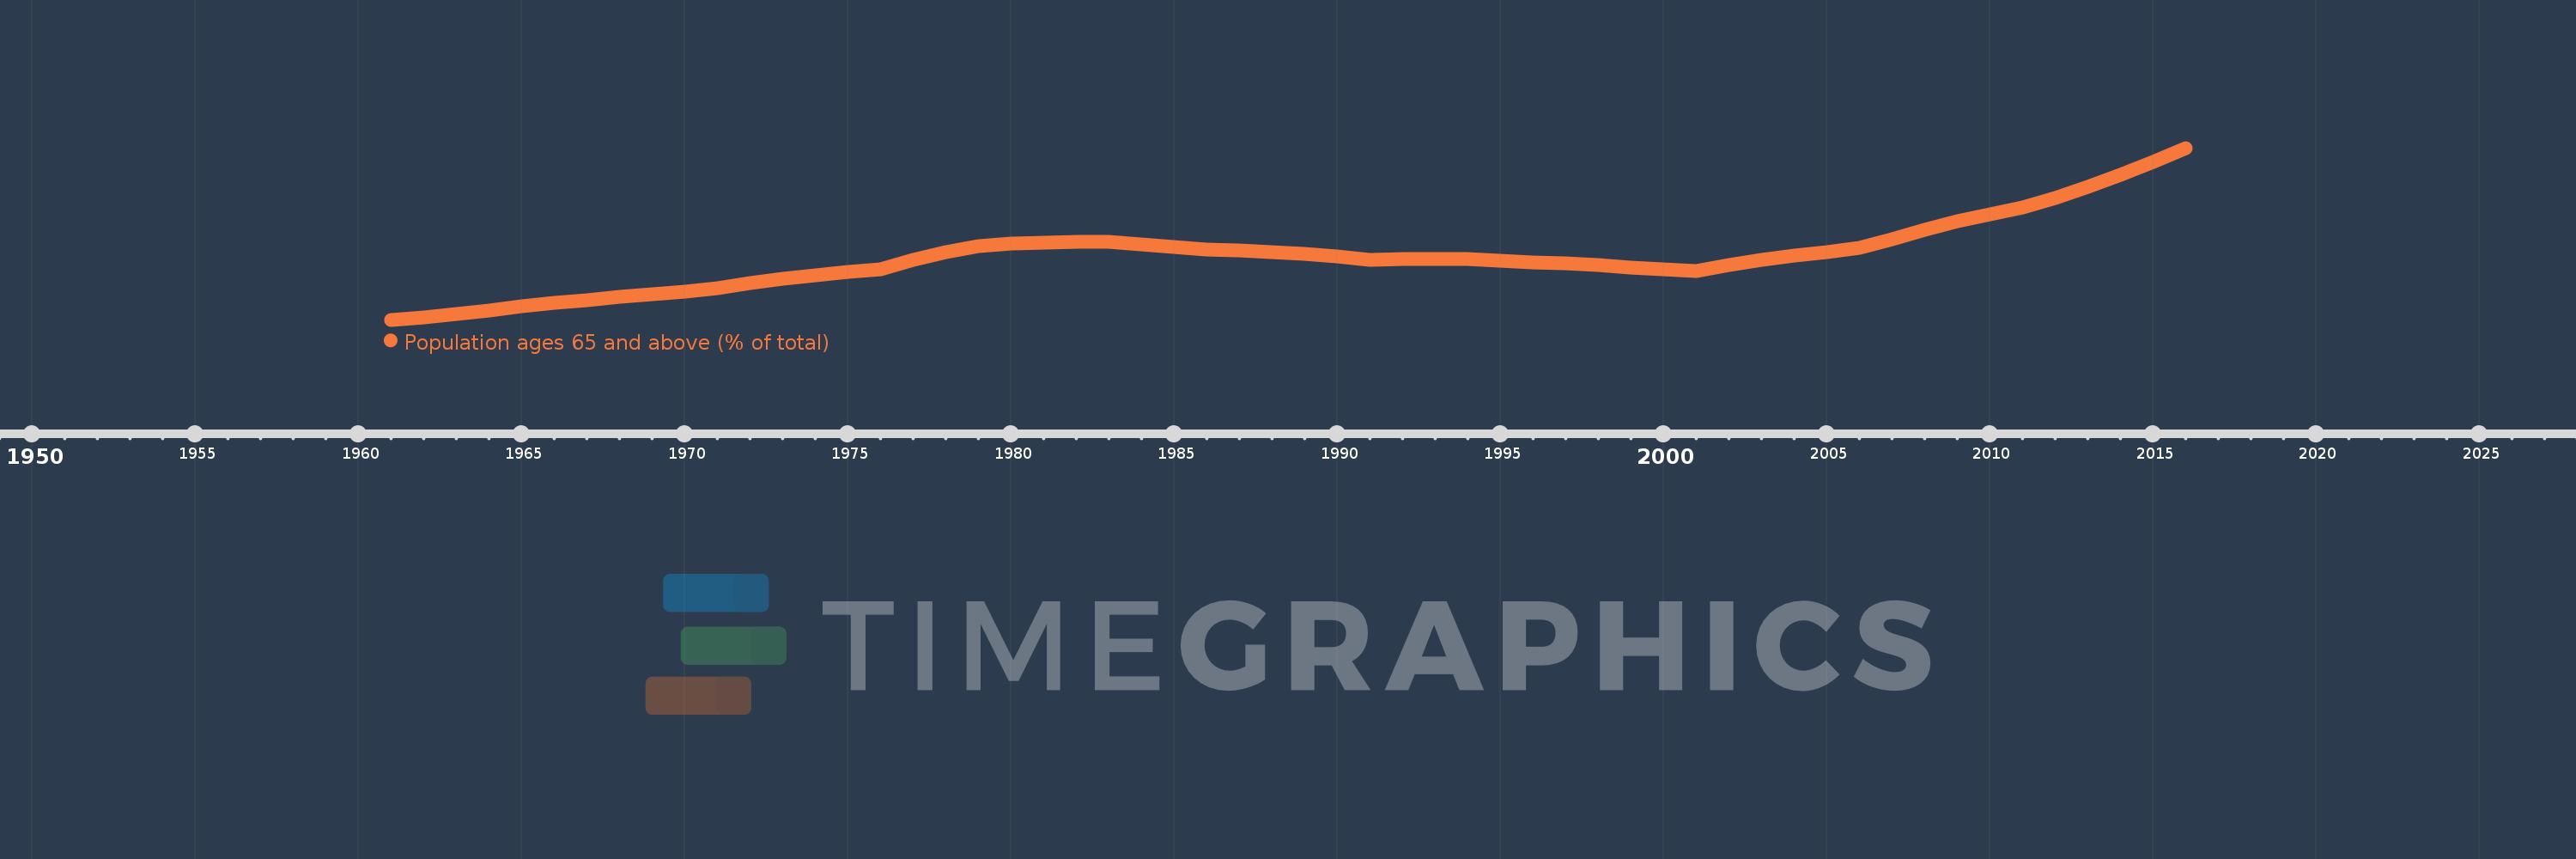
Population ages 65 and above (% of total)
2016,2015,2014,2013,2012,2011,2010,2009,2008,2007,2006,2005,2004,2003,2002,2001,2000,1999,1998,1997,1996,1995,1994,1993,1992,1991,1990,1989,1988,1987,1986,1985,1984,1983,1982,1981,1980,1979,1978,1977,1976,1975,1974,1973,1972,1971,1970,1969,1968,1967,1966,1965,1964,1963,1962,1961
This statistics in other country:
AfghanistanAlbaniaAlgeriaAngolaAntigua and BarbudaArab WorldArgentinaArmeniaArubaAustraliaAustriaAzerbaijanBahamas, TheBahrainBangladeshBarbadosBelarusBelgiumBelizeBeninBhutanBoliviaBosnia and HerzegovinaBotswanaBrazilBrunei DarussalamBulgariaBurkina FasoBurundiCabo VerdeCambodiaCameroonCanadaCaribbean small statesCentral African RepublicCentral Europe and the BalticsChadChannel IslandsChileChinaColombiaComorosCongo, Dem. Rep.Congo, Rep.Costa RicaCote d'IvoireCroatiaCubaCuracaoCyprusCzech RepublicDenmarkDjiboutiDominican RepublicEarly-demographic dividendEast Asia & PacificEast Asia & Pacific (excluding high income)East Asia & Pacific (IDA & IBRD countries)EcuadorEgypt, Arab Rep.El SalvadorEquatorial GuineaEritreaEstoniaEthiopiaEuro areaEurope & Central AsiaEurope & Central Asia (excluding high income)Europe & Central Asia (IDA & IBRD countries)European UnionFijiFinlandFragile and conflict affected situationsFranceFrench PolynesiaGabonGambia, TheGeorgiaGermanyGhanaGreeceGrenadaGuamGuatemalaGuineaGuinea-BissauGuyanaHaitiHeavily indebted poor countries (HIPC)High incomeHondurasHong Kong SAR, ChinaHungaryIBRD onlyIcelandIDA & IBRD totalIDA blendIDA onlyIDA totalIndiaIndonesiaIran, Islamic Rep.IraqIrelandIsraelItalyJamaicaJapanJordanKazakhstanKenyaKiribatiKorea, Dem. People’s Rep.Korea, Rep.KosovoKuwaitKyrgyz RepublicLao PDRLate-demographic dividendLatin America & Caribbean Latin America & Caribbean (excluding high income)Latin America & the Caribbean (IDA & IBRD countries)LatviaLeast developed countries: UN classificationLebanonLesothoLiberiaLibyaLithuaniaLow & middle incomeLow incomeLower middle incomeLuxembourgMacao SAR, ChinaMacedonia, FYRMadagascarMalawiMalaysiaMaldivesMaliMaltaMauritaniaMauritiusMexicoMicronesia, Fed. Sts.Middle East & North AfricaMiddle East & North Africa (excluding high income)Middle East & North Africa (IDA & IBRD countries)Middle incomeMoldovaMongoliaMontenegroMoroccoMozambiqueMyanmarNamibiaNepalNetherlandsNew CaledoniaNew ZealandNicaraguaNigerNigeriaNorth AmericaNorwayOECD membersOmanOther small statesPacific island small statesPakistanPanamaPapua New GuineaParaguayPeruPhilippinesPolandPortugalPost-demographic dividendPre-demographic dividendPuerto RicoQatarRomaniaRussian FederationRwandaSamoaSao Tome and PrincipeSaudi ArabiaSenegalSerbiaSeychellesSierra LeoneSingaporeSlovak RepublicSloveniaSmall statesSolomon IslandsSomaliaSouth AfricaSouth AsiaSouth Asia (IDA & IBRD)South SudanSpainSri LankaSt. LuciaSt. Vincent and the GrenadinesSub-Saharan Africa Sub-Saharan Africa (excluding high income)Sub-Saharan Africa (IDA & IBRD countries)SudanSurinameSwazilandSwedenSwitzerlandSyrian Arab RepublicTajikistanTanzaniaThailandTimor-LesteTogoTongaTrinidad and TobagoTunisiaTurkeyTurkmenistanUgandaUkraineUnited Arab EmiratesUnited KingdomUnited StatesUpper middle incomeUruguayUzbekistanVanuatuVenezuela, RBVietnamVirgin Islands (U.S.)West Bank and GazaWorldYemen, Rep.ZambiaZimbabwe Timeline:
This timeline shows a graph from 1961 to 2016 of Channel Islands. No data until 1960. Number of actual observations by date: 56.
Source name:
World Development Indicators
Source organization:
World Bank staff estimates based on age distributions of United Nations Population Division's World Population Prospects.
Categories, topics:
Health
Last updated:
apr 23, 2017
Indicators value changes by year
Minimum:
13.166
jan 1, 1961
Maximum:
17.268
jan 1, 2016
At the date of observation
Value
Absolute change
Change from previous value
jan 1, 1961
13.166
+13.166
0.0%
jan 1, 1962
13.218
+0.053
0.4%
jan 1, 1963
13.297
+0.078
0.59%
jan 1, 1964
13.389
+0.092
0.69%
jan 1, 1965
13.482
+0.094
0.7%
jan 1, 1966
13.573
+0.091
0.67%
jan 1, 1967
13.635
+0.062
0.45%
jan 1, 1968
13.704
+0.07
0.51%
jan 1, 1969
13.773
+0.069
0.5%
jan 1, 1970
13.843
+0.07
0.51%
jan 1, 1971
13.923
+0.08
0.57%
jan 1, 1972
14.043
+0.12
0.86%
jan 1, 1973
14.14
+0.098
0.7%
jan 1, 1974
14.224
+0.083
0.59%
jan 1, 1975
14.3
+0.076
0.53%
jan 1, 1976
14.379
+0.079
0.55%
jan 1, 1977
14.599
+0.22
1.53%
jan 1, 1978
14.787
+0.188
1.29%
jan 1, 1979
14.923
+0.136
0.92%
jan 1, 1980
14.991
+0.068
0.46%
jan 1, 1981
15.006
+0.015
0.1%
jan 1, 1982
15.034
+0.028
0.18%
jan 1, 1983
15.018
-0.016
-0.11%
jan 1, 1984
14.968
-0.05
-0.33%
jan 1, 1985
14.903
-0.065
-0.44%
jan 1, 1986
14.84
-0.063
-0.42%
jan 1, 1987
14.816
-0.025
-0.17%
jan 1, 1988
14.782
-0.033
-0.23%
jan 1, 1989
14.737
-0.045
-0.3%
jan 1, 1990
14.675
-0.062
-0.42%
jan 1, 1991
14.595
-0.08
-0.54%
jan 1, 1992
14.613
+0.018
0.12%
jan 1, 1993
14.619
+0.006
0.04%
jan 1, 1994
14.608
-0.012
-0.08%
jan 1, 1995
14.577
-0.031
-0.21%
jan 1, 1996
14.526
-0.05
-0.35%
jan 1, 1997
14.52
-0.007
-0.05%
jan 1, 1998
14.478
-0.041
-0.29%
jan 1, 1999
14.418
-0.06
-0.41%
jan 1, 2000
14.363
-0.056
-0.39%
jan 1, 2001
14.325
-0.038
-0.26%
jan 1, 2002
14.469
+0.144
1.0%
jan 1, 2003
14.601
+0.132
0.91%
jan 1, 2004
14.7
+0.099
0.68%
jan 1, 2005
14.78
+0.08
0.54%
jan 1, 2006
14.887
+0.108
0.73%
jan 1, 2007
15.086
+0.199
1.33%
jan 1, 2008
15.308
+0.222
1.47%
jan 1, 2009
15.514
+0.206
1.34%
jan 1, 2010
15.682
+0.168
1.08%
jan 1, 2011
15.843
+0.161
1.03%
jan 1, 2012
16.073
+0.23
1.45%
jan 1, 2013
16.335
+0.262
1.63%
jan 1, 2014
16.625
+0.289
1.77%
jan 1, 2015
16.936
+0.312
1.87%
jan 1, 2016
17.268
+0.332
1.96%
Ranking of countries by current statistics by years


Comments: