29
/
en
AIzaSyAYiBZKx7MnpbEhh9jyipgxe19OcubqV5w
April 1, 2024
232617
Samoa
WSM
true
2
1
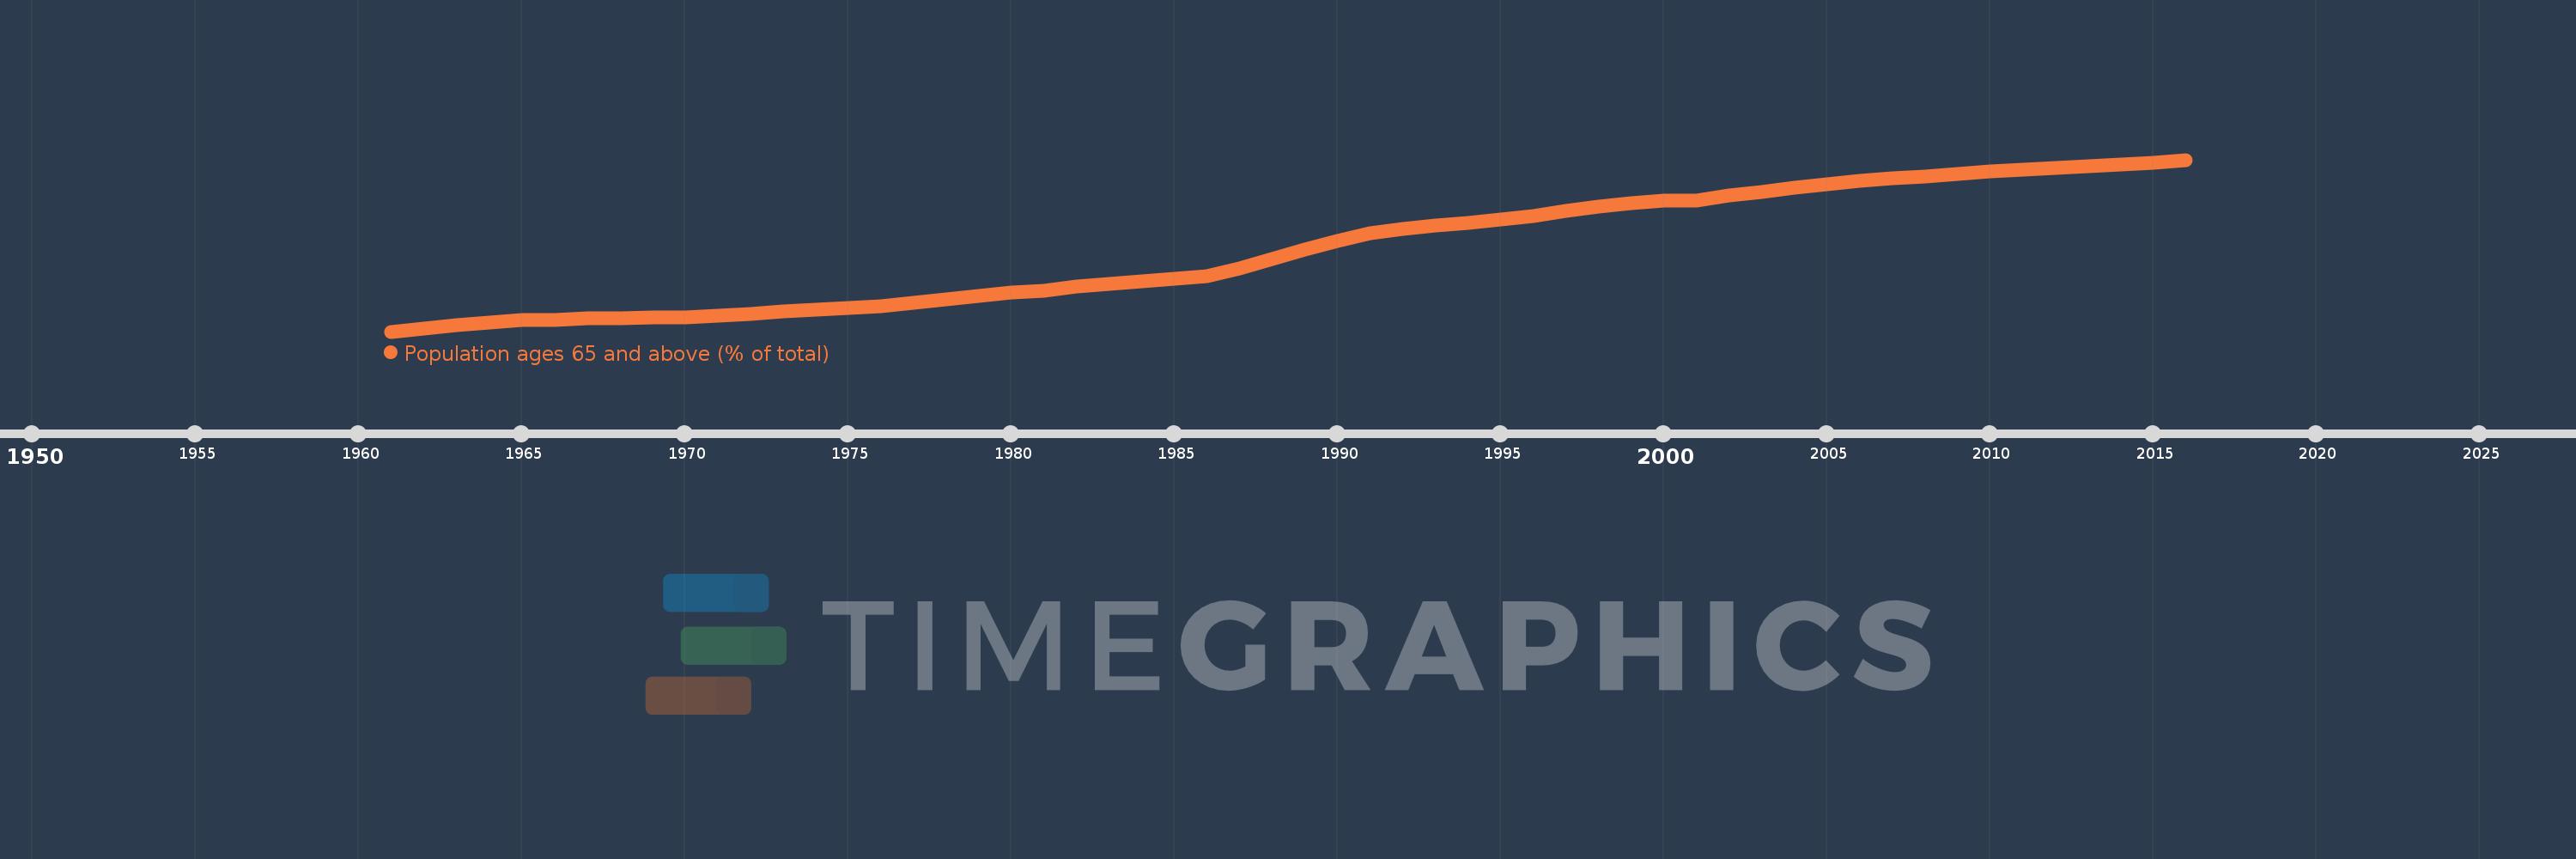
Population ages 65 and above (% of total)
2016,2015,2014,2013,2012,2011,2010,2009,2008,2007,2006,2005,2004,2003,2002,2001,2000,1999,1998,1997,1996,1995,1994,1993,1992,1991,1990,1989,1988,1987,1986,1985,1984,1983,1982,1981,1980,1979,1978,1977,1976,1975,1974,1973,1972,1971,1970,1969,1968,1967,1966,1965,1964,1963,1962,1961
This statistics in other country:
AfghanistanAlbaniaAlgeriaAngolaAntigua and BarbudaArab WorldArgentinaArmeniaArubaAustraliaAustriaAzerbaijanBahamas, TheBahrainBangladeshBarbadosBelarusBelgiumBelizeBeninBhutanBoliviaBosnia and HerzegovinaBotswanaBrazilBrunei DarussalamBulgariaBurkina FasoBurundiCabo VerdeCambodiaCameroonCanadaCaribbean small statesCentral African RepublicCentral Europe and the BalticsChadChannel IslandsChileChinaColombiaComorosCongo, Dem. Rep.Congo, Rep.Costa RicaCote d'IvoireCroatiaCubaCuracaoCyprusCzech RepublicDenmarkDjiboutiDominican RepublicEarly-demographic dividendEast Asia & PacificEast Asia & Pacific (excluding high income)East Asia & Pacific (IDA & IBRD countries)EcuadorEgypt, Arab Rep.El SalvadorEquatorial GuineaEritreaEstoniaEthiopiaEuro areaEurope & Central AsiaEurope & Central Asia (excluding high income)Europe & Central Asia (IDA & IBRD countries)European UnionFijiFinlandFragile and conflict affected situationsFranceFrench PolynesiaGabonGambia, TheGeorgiaGermanyGhanaGreeceGrenadaGuamGuatemalaGuineaGuinea-BissauGuyanaHaitiHeavily indebted poor countries (HIPC)High incomeHondurasHong Kong SAR, ChinaHungaryIBRD onlyIcelandIDA & IBRD totalIDA blendIDA onlyIDA totalIndiaIndonesiaIran, Islamic Rep.IraqIrelandIsraelItalyJamaicaJapanJordanKazakhstanKenyaKiribatiKorea, Dem. People’s Rep.Korea, Rep.KosovoKuwaitKyrgyz RepublicLao PDRLate-demographic dividendLatin America & Caribbean Latin America & Caribbean (excluding high income)Latin America & the Caribbean (IDA & IBRD countries)LatviaLeast developed countries: UN classificationLebanonLesothoLiberiaLibyaLithuaniaLow & middle incomeLow incomeLower middle incomeLuxembourgMacao SAR, ChinaMacedonia, FYRMadagascarMalawiMalaysiaMaldivesMaliMaltaMauritaniaMauritiusMexicoMicronesia, Fed. Sts.Middle East & North AfricaMiddle East & North Africa (excluding high income)Middle East & North Africa (IDA & IBRD countries)Middle incomeMoldovaMongoliaMontenegroMoroccoMozambiqueMyanmarNamibiaNepalNetherlandsNew CaledoniaNew ZealandNicaraguaNigerNigeriaNorth AmericaNorwayOECD membersOmanOther small statesPacific island small statesPakistanPanamaPapua New GuineaParaguayPeruPhilippinesPolandPortugalPost-demographic dividendPre-demographic dividendPuerto RicoQatarRomaniaRussian FederationRwandaSamoaSao Tome and PrincipeSaudi ArabiaSenegalSerbiaSeychellesSierra LeoneSingaporeSlovak RepublicSloveniaSmall statesSolomon IslandsSomaliaSouth AfricaSouth AsiaSouth Asia (IDA & IBRD)South SudanSpainSri LankaSt. LuciaSt. Vincent and the GrenadinesSub-Saharan Africa Sub-Saharan Africa (excluding high income)Sub-Saharan Africa (IDA & IBRD countries)SudanSurinameSwazilandSwedenSwitzerlandSyrian Arab RepublicTajikistanTanzaniaThailandTimor-LesteTogoTongaTrinidad and TobagoTunisiaTurkeyTurkmenistanUgandaUkraineUnited Arab EmiratesUnited KingdomUnited StatesUpper middle incomeUruguayUzbekistanVanuatuVenezuela, RBVietnamVirgin Islands (U.S.)West Bank and GazaWorldYemen, Rep.ZambiaZimbabwe Timeline:
This timeline shows a graph from 1961 to 2016 of Samoa. No data until 1960. Number of actual observations by date: 56.
Source name:
World Development Indicators
Source organization:
World Bank staff estimates based on age distributions of United Nations Population Division's World Population Prospects.
Categories, topics:
Health
Last updated:
apr 23, 2017
Indicators value changes by year
At the date of observation
Value
Absolute change
Change from previous value
jan 1, 1961
2.005
+2.005
0.0%
jan 1, 1962
2.057
+0.052
2.59%
jan 1, 1963
2.12
+0.064
3.09%
jan 1, 1964
2.177
+0.057
2.68%
jan 1, 1965
2.215
+0.038
1.73%
jan 1, 1966
2.229
+0.014
0.63%
jan 1, 1967
2.251
+0.022
1.01%
jan 1, 1968
2.263
+0.012
0.53%
jan 1, 1969
2.269
+0.006
0.26%
jan 1, 1970
2.279
+0.01
0.42%
jan 1, 1971
2.296
+0.018
0.78%
jan 1, 1972
2.343
+0.046
2.01%
jan 1, 1973
2.381
+0.039
1.65%
jan 1, 1974
2.413
+0.031
1.32%
jan 1, 1975
2.442
+0.03
1.24%
jan 1, 1976
2.477
+0.034
1.39%
jan 1, 1977
2.547
+0.071
2.86%
jan 1, 1978
2.617
+0.07
2.75%
jan 1, 1979
2.682
+0.064
2.45%
jan 1, 1980
2.733
+0.052
1.92%
jan 1, 1981
2.774
+0.041
1.49%
jan 1, 1982
2.85
+0.076
2.76%
jan 1, 1983
2.908
+0.058
2.04%
jan 1, 1984
2.952
+0.044
1.51%
jan 1, 1985
2.993
+0.041
1.39%
jan 1, 1986
3.041
+0.047
1.58%
jan 1, 1987
3.194
+0.153
5.04%
jan 1, 1988
3.364
+0.17
5.34%
jan 1, 1989
3.544
+0.18
5.34%
jan 1, 1990
3.712
+0.168
4.75%
jan 1, 1991
3.856
+0.144
3.87%
jan 1, 1992
3.937
+0.081
2.09%
jan 1, 1993
3.997
+0.06
1.52%
jan 1, 1994
4.049
+0.052
1.31%
jan 1, 1995
4.105
+0.056
1.39%
jan 1, 1996
4.171
+0.066
1.6%
jan 1, 1997
4.269
+0.098
2.36%
jan 1, 1998
4.357
+0.088
2.05%
jan 1, 1999
4.423
+0.066
1.52%
jan 1, 2000
4.46
+0.037
0.84%
jan 1, 2001
4.474
+0.014
0.31%
jan 1, 2002
4.556
+0.082
1.83%
jan 1, 2003
4.629
+0.074
1.62%
jan 1, 2004
4.703
+0.074
1.59%
jan 1, 2005
4.774
+0.071
1.52%
jan 1, 2006
4.839
+0.065
1.36%
jan 1, 2007
4.885
+0.046
0.95%
jan 1, 2008
4.927
+0.041
0.84%
jan 1, 2009
4.971
+0.044
0.89%
jan 1, 2010
5.015
+0.044
0.89%
jan 1, 2011
5.051
+0.037
0.73%
jan 1, 2012
5.084
+0.033
0.64%
jan 1, 2013
5.113
+0.029
0.57%
jan 1, 2014
5.141
+0.028
0.54%
jan 1, 2015
5.179
+0.038
0.74%
jan 1, 2016
5.234
+0.055
1.06%
Ranking of countries by current statistics by years


Comments: