29
/
en
AIzaSyAYiBZKx7MnpbEhh9jyipgxe19OcubqV5w
April 1, 2024
57475
South Asia
SAS
false
2
1
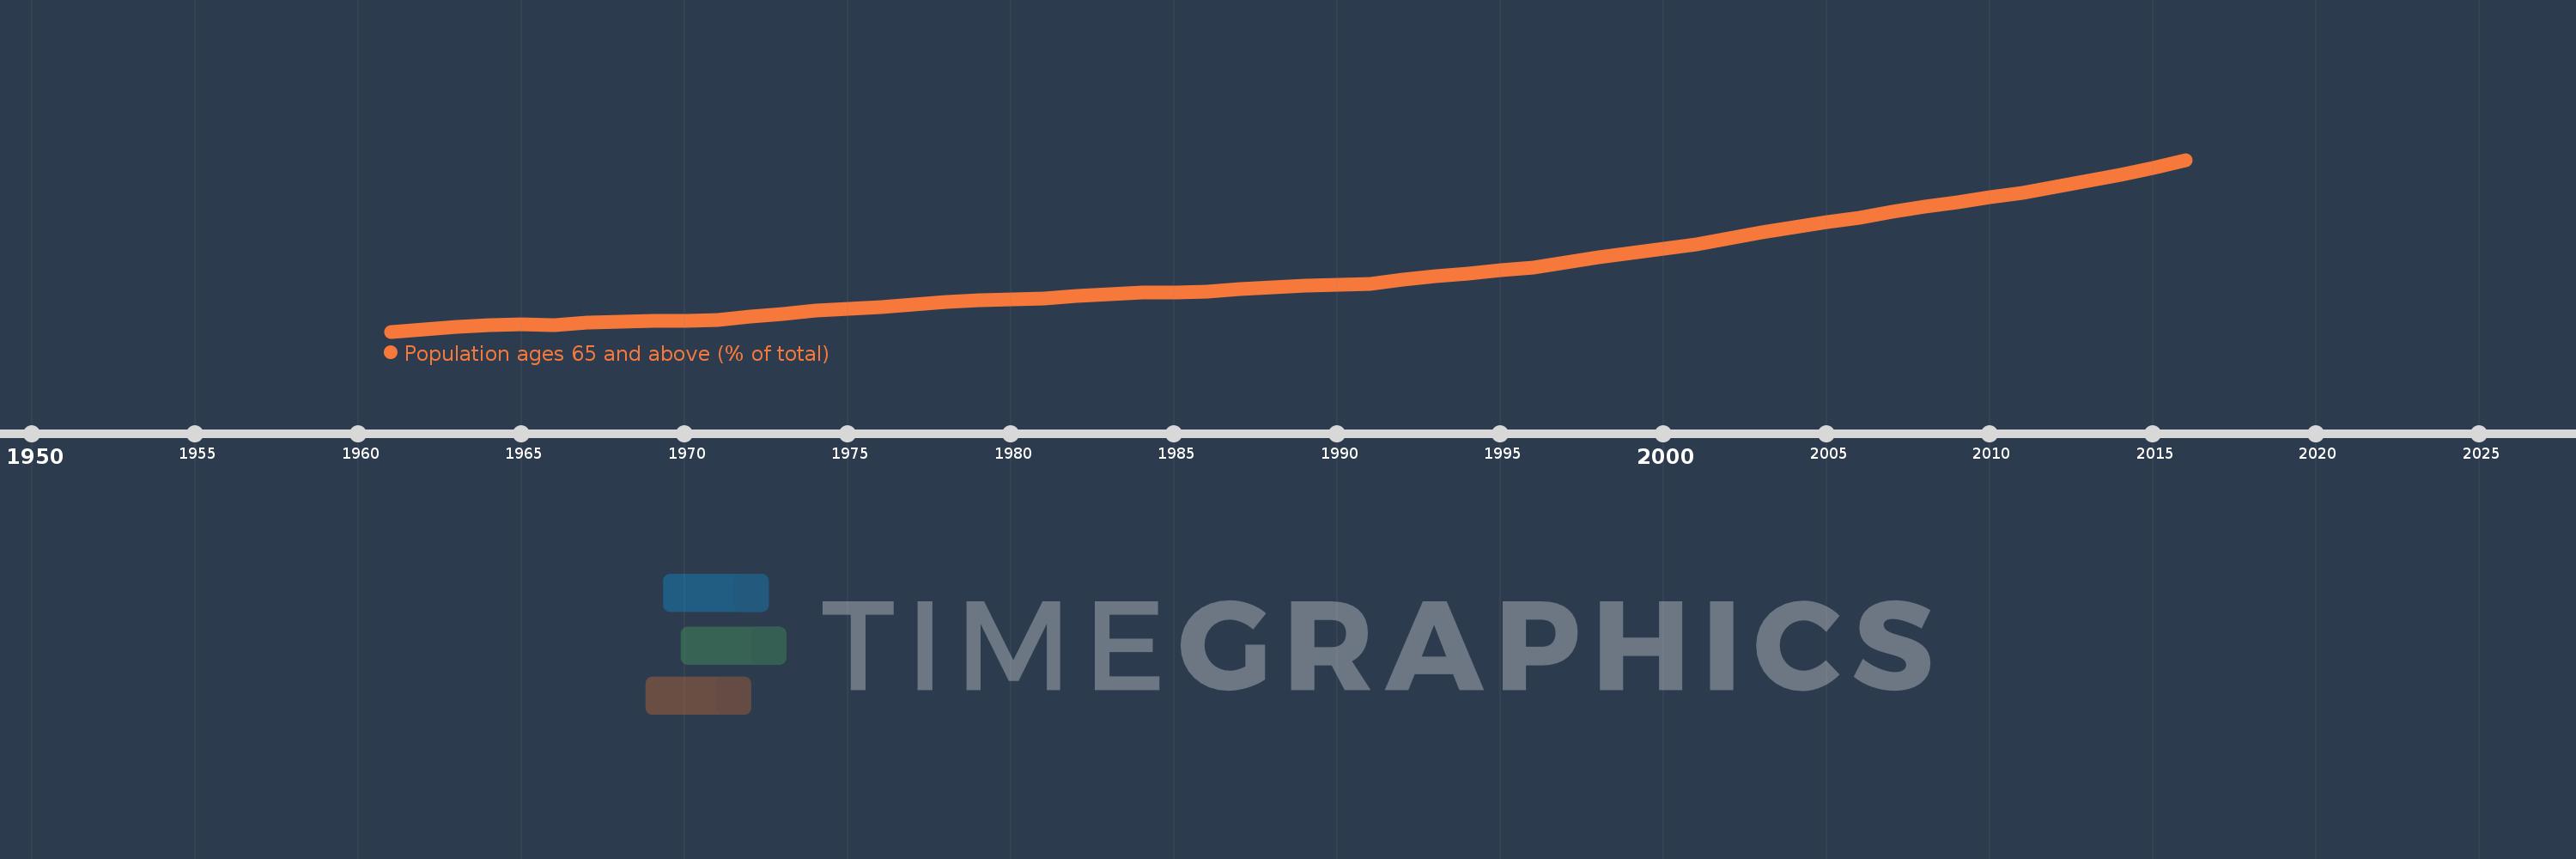
Population ages 65 and above (% of total)
2016,2015,2014,2013,2012,2011,2010,2009,2008,2007,2006,2005,2004,2003,2002,2001,2000,1999,1998,1997,1996,1995,1994,1993,1992,1991,1990,1989,1988,1987,1986,1985,1984,1983,1982,1981,1980,1979,1978,1977,1976,1975,1974,1973,1972,1971,1970,1969,1968,1967,1966,1965,1964,1963,1962,1961
This statistics in other country:
AfghanistanAlbaniaAlgeriaAngolaAntigua and BarbudaArab WorldArgentinaArmeniaArubaAustraliaAustriaAzerbaijanBahamas, TheBahrainBangladeshBarbadosBelarusBelgiumBelizeBeninBhutanBoliviaBosnia and HerzegovinaBotswanaBrazilBrunei DarussalamBulgariaBurkina FasoBurundiCabo VerdeCambodiaCameroonCanadaCaribbean small statesCentral African RepublicCentral Europe and the BalticsChadChannel IslandsChileChinaColombiaComorosCongo, Dem. Rep.Congo, Rep.Costa RicaCote d'IvoireCroatiaCubaCuracaoCyprusCzech RepublicDenmarkDjiboutiDominican RepublicEarly-demographic dividendEast Asia & PacificEast Asia & Pacific (excluding high income)East Asia & Pacific (IDA & IBRD countries)EcuadorEgypt, Arab Rep.El SalvadorEquatorial GuineaEritreaEstoniaEthiopiaEuro areaEurope & Central AsiaEurope & Central Asia (excluding high income)Europe & Central Asia (IDA & IBRD countries)European UnionFijiFinlandFragile and conflict affected situationsFranceFrench PolynesiaGabonGambia, TheGeorgiaGermanyGhanaGreeceGrenadaGuamGuatemalaGuineaGuinea-BissauGuyanaHaitiHeavily indebted poor countries (HIPC)High incomeHondurasHong Kong SAR, ChinaHungaryIBRD onlyIcelandIDA & IBRD totalIDA blendIDA onlyIDA totalIndiaIndonesiaIran, Islamic Rep.IraqIrelandIsraelItalyJamaicaJapanJordanKazakhstanKenyaKiribatiKorea, Dem. People’s Rep.Korea, Rep.KosovoKuwaitKyrgyz RepublicLao PDRLate-demographic dividendLatin America & Caribbean Latin America & Caribbean (excluding high income)Latin America & the Caribbean (IDA & IBRD countries)LatviaLeast developed countries: UN classificationLebanonLesothoLiberiaLibyaLithuaniaLow & middle incomeLow incomeLower middle incomeLuxembourgMacao SAR, ChinaMacedonia, FYRMadagascarMalawiMalaysiaMaldivesMaliMaltaMauritaniaMauritiusMexicoMicronesia, Fed. Sts.Middle East & North AfricaMiddle East & North Africa (excluding high income)Middle East & North Africa (IDA & IBRD countries)Middle incomeMoldovaMongoliaMontenegroMoroccoMozambiqueMyanmarNamibiaNepalNetherlandsNew CaledoniaNew ZealandNicaraguaNigerNigeriaNorth AmericaNorwayOECD membersOmanOther small statesPacific island small statesPakistanPanamaPapua New GuineaParaguayPeruPhilippinesPolandPortugalPost-demographic dividendPre-demographic dividendPuerto RicoQatarRomaniaRussian FederationRwandaSamoaSao Tome and PrincipeSaudi ArabiaSenegalSerbiaSeychellesSierra LeoneSingaporeSlovak RepublicSloveniaSmall statesSolomon IslandsSomaliaSouth AfricaSouth AsiaSouth Asia (IDA & IBRD)South SudanSpainSri LankaSt. LuciaSt. Vincent and the GrenadinesSub-Saharan Africa Sub-Saharan Africa (excluding high income)Sub-Saharan Africa (IDA & IBRD countries)SudanSurinameSwazilandSwedenSwitzerlandSyrian Arab RepublicTajikistanTanzaniaThailandTimor-LesteTogoTongaTrinidad and TobagoTunisiaTurkeyTurkmenistanUgandaUkraineUnited Arab EmiratesUnited KingdomUnited StatesUpper middle incomeUruguayUzbekistanVanuatuVenezuela, RBVietnamVirgin Islands (U.S.)West Bank and GazaWorldYemen, Rep.ZambiaZimbabwe Timeline:
This timeline shows a graph from 1961 to 2016 of South Asia. No data until 1960. Number of actual observations by date: 56.
Source name:
World Development Indicators
Source organization:
World Bank staff estimates based on age distributions of United Nations Population Division's World Population Prospects.
Categories, topics:
Health
Last updated:
apr 23, 2017
Indicators value changes by year
At the date of observation
Value
Absolute change
Change from previous value
jan 1, 1961
3.144
+3.144
0.0%
jan 1, 1962
3.177
+0.033
1.06%
jan 1, 1963
3.208
+0.031
0.97%
jan 1, 1964
3.231
+0.023
0.7%
jan 1, 1965
3.24
+0.009
0.28%
jan 1, 1966
3.233
-0.007
-0.2%
jan 1, 1967
3.263
+0.03
0.93%
jan 1, 1968
3.28
+0.017
0.51%
jan 1, 1969
3.287
+0.008
0.23%
jan 1, 1970
3.291
+0.004
0.12%
jan 1, 1971
3.295
+0.003
0.11%
jan 1, 1972
3.34
+0.045
1.38%
jan 1, 1973
3.382
+0.042
1.25%
jan 1, 1974
3.418
+0.036
1.06%
jan 1, 1975
3.445
+0.027
0.8%
jan 1, 1976
3.464
+0.019
0.55%
jan 1, 1977
3.505
+0.041
1.17%
jan 1, 1978
3.535
+0.031
0.87%
jan 1, 1979
3.558
+0.022
0.63%
jan 1, 1980
3.574
+0.016
0.45%
jan 1, 1981
3.585
+0.011
0.31%
jan 1, 1982
3.617
+0.033
0.91%
jan 1, 1983
3.641
+0.024
0.66%
jan 1, 1984
3.657
+0.016
0.44%
jan 1, 1985
3.667
+0.01
0.26%
jan 1, 1986
3.672
+0.005
0.14%
jan 1, 1987
3.703
+0.031
0.85%
jan 1, 1988
3.728
+0.025
0.67%
jan 1, 1989
3.748
+0.02
0.53%
jan 1, 1990
3.763
+0.015
0.41%
jan 1, 1991
3.775
+0.012
0.32%
jan 1, 1992
3.827
+0.052
1.37%
jan 1, 1993
3.873
+0.046
1.21%
jan 1, 1994
3.915
+0.042
1.08%
jan 1, 1995
3.954
+0.039
0.99%
jan 1, 1996
3.991
+0.037
0.94%
jan 1, 1997
4.061
+0.07
1.75%
jan 1, 1998
4.125
+0.064
1.58%
jan 1, 1999
4.186
+0.06
1.46%
jan 1, 2000
4.244
+0.059
1.4%
jan 1, 2001
4.303
+0.058
1.38%
jan 1, 2002
4.381
+0.078
1.82%
jan 1, 2003
4.456
+0.075
1.72%
jan 1, 2004
4.527
+0.071
1.6%
jan 1, 2005
4.593
+0.066
1.45%
jan 1, 2006
4.653
+0.06
1.31%
jan 1, 2007
4.728
+0.075
1.61%
jan 1, 2008
4.797
+0.068
1.45%
jan 1, 2009
4.86
+0.063
1.32%
jan 1, 2010
4.92
+0.06
1.23%
jan 1, 2011
4.978
+0.058
1.18%
jan 1, 2012
5.061
+0.083
1.67%
jan 1, 2013
5.141
+0.08
1.58%
jan 1, 2014
5.224
+0.082
1.6%
jan 1, 2015
5.315
+0.091
1.75%
jan 1, 2016
5.419
+0.104
1.96%
Ranking of countries by current statistics by years


Comments: