29
/
en
AIzaSyAYiBZKx7MnpbEhh9jyipgxe19OcubqV5w
April 1, 2024
176887
Lebanon
LBN
true
2
1
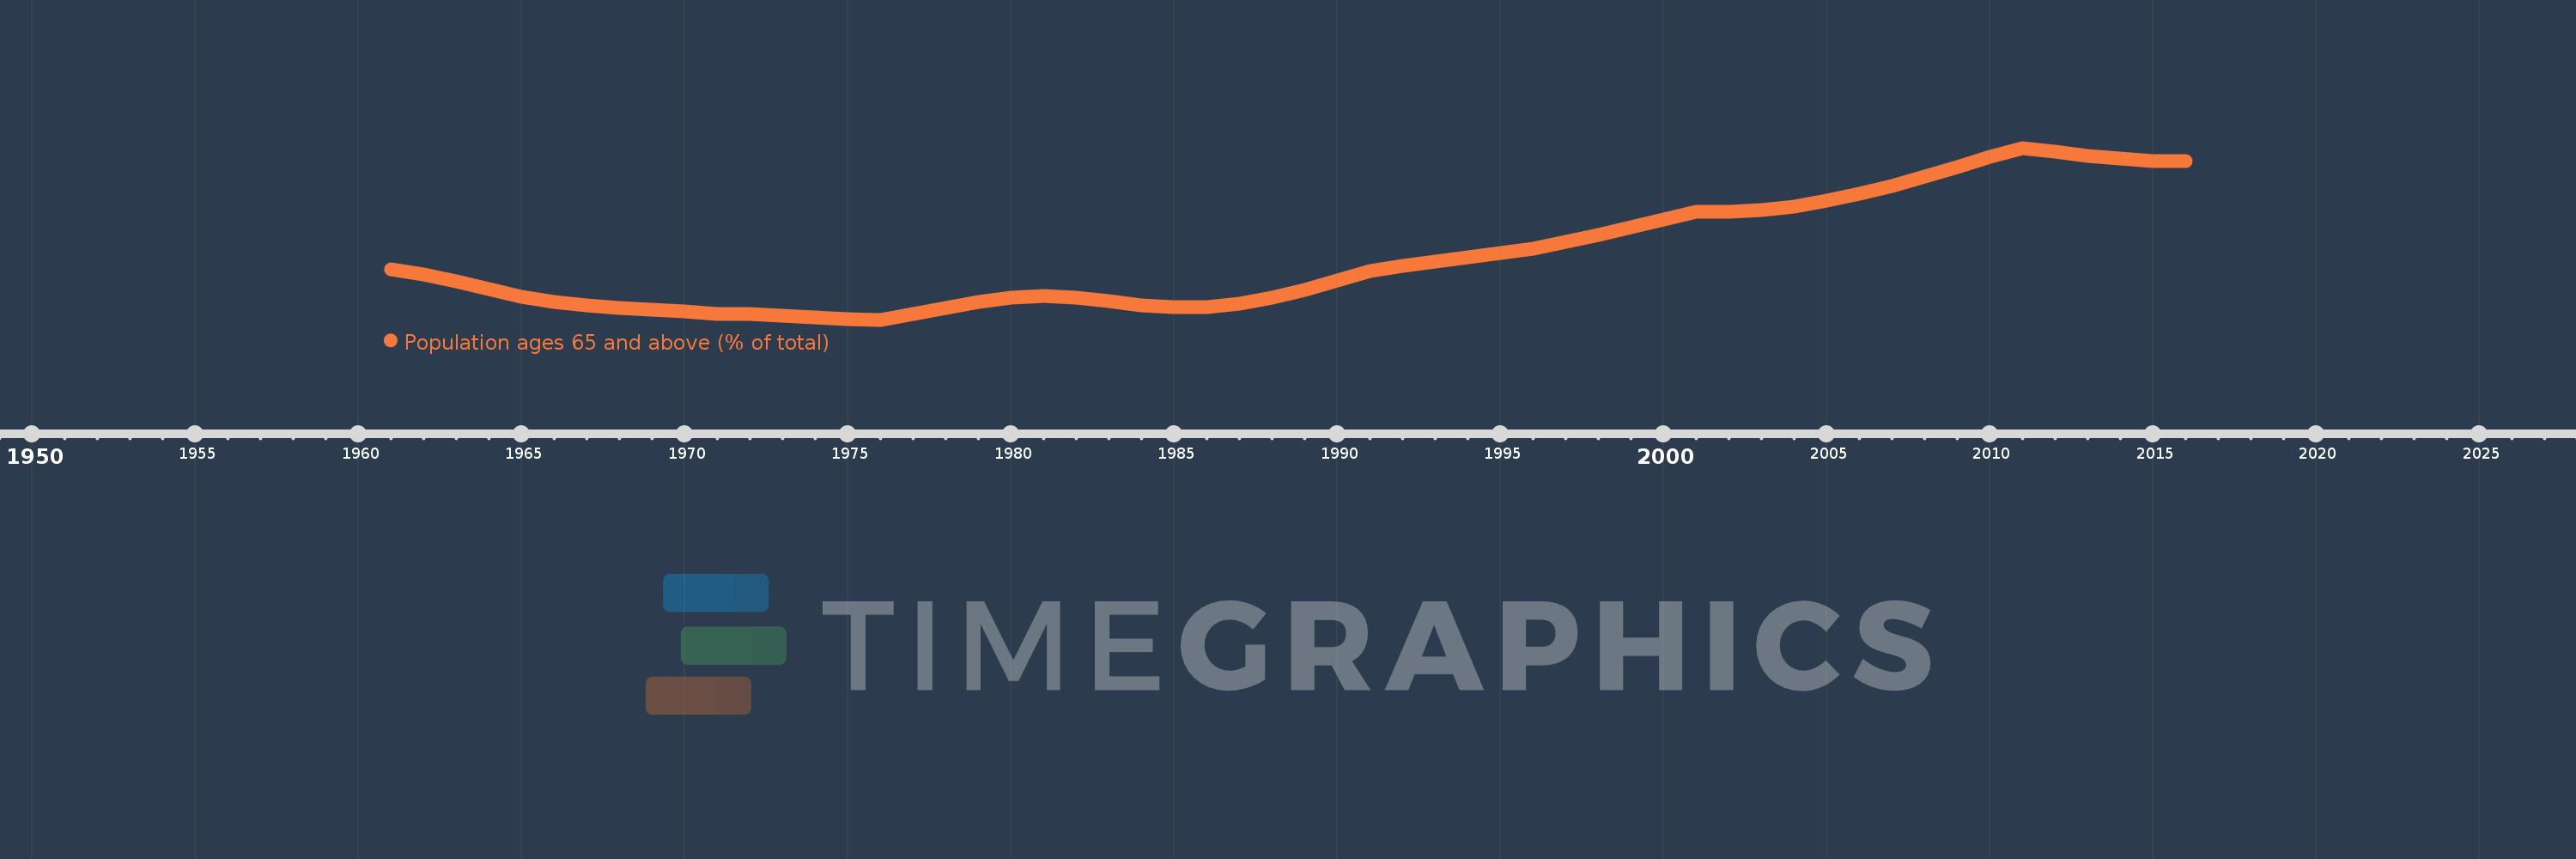
Population ages 65 and above (% of total)
2016,2015,2014,2013,2012,2011,2010,2009,2008,2007,2006,2005,2004,2003,2002,2001,2000,1999,1998,1997,1996,1995,1994,1993,1992,1991,1990,1989,1988,1987,1986,1985,1984,1983,1982,1981,1980,1979,1978,1977,1976,1975,1974,1973,1972,1971,1970,1969,1968,1967,1966,1965,1964,1963,1962,1961
This statistics in other country:
AfghanistanAlbaniaAlgeriaAngolaAntigua and BarbudaArab WorldArgentinaArmeniaArubaAustraliaAustriaAzerbaijanBahamas, TheBahrainBangladeshBarbadosBelarusBelgiumBelizeBeninBhutanBoliviaBosnia and HerzegovinaBotswanaBrazilBrunei DarussalamBulgariaBurkina FasoBurundiCabo VerdeCambodiaCameroonCanadaCaribbean small statesCentral African RepublicCentral Europe and the BalticsChadChannel IslandsChileChinaColombiaComorosCongo, Dem. Rep.Congo, Rep.Costa RicaCote d'IvoireCroatiaCubaCuracaoCyprusCzech RepublicDenmarkDjiboutiDominican RepublicEarly-demographic dividendEast Asia & PacificEast Asia & Pacific (excluding high income)East Asia & Pacific (IDA & IBRD countries)EcuadorEgypt, Arab Rep.El SalvadorEquatorial GuineaEritreaEstoniaEthiopiaEuro areaEurope & Central AsiaEurope & Central Asia (excluding high income)Europe & Central Asia (IDA & IBRD countries)European UnionFijiFinlandFragile and conflict affected situationsFranceFrench PolynesiaGabonGambia, TheGeorgiaGermanyGhanaGreeceGrenadaGuamGuatemalaGuineaGuinea-BissauGuyanaHaitiHeavily indebted poor countries (HIPC)High incomeHondurasHong Kong SAR, ChinaHungaryIBRD onlyIcelandIDA & IBRD totalIDA blendIDA onlyIDA totalIndiaIndonesiaIran, Islamic Rep.IraqIrelandIsraelItalyJamaicaJapanJordanKazakhstanKenyaKiribatiKorea, Dem. People’s Rep.Korea, Rep.KosovoKuwaitKyrgyz RepublicLao PDRLate-demographic dividendLatin America & Caribbean Latin America & Caribbean (excluding high income)Latin America & the Caribbean (IDA & IBRD countries)LatviaLeast developed countries: UN classificationLebanonLesothoLiberiaLibyaLithuaniaLow & middle incomeLow incomeLower middle incomeLuxembourgMacao SAR, ChinaMacedonia, FYRMadagascarMalawiMalaysiaMaldivesMaliMaltaMauritaniaMauritiusMexicoMicronesia, Fed. Sts.Middle East & North AfricaMiddle East & North Africa (excluding high income)Middle East & North Africa (IDA & IBRD countries)Middle incomeMoldovaMongoliaMontenegroMoroccoMozambiqueMyanmarNamibiaNepalNetherlandsNew CaledoniaNew ZealandNicaraguaNigerNigeriaNorth AmericaNorwayOECD membersOmanOther small statesPacific island small statesPakistanPanamaPapua New GuineaParaguayPeruPhilippinesPolandPortugalPost-demographic dividendPre-demographic dividendPuerto RicoQatarRomaniaRussian FederationRwandaSamoaSao Tome and PrincipeSaudi ArabiaSenegalSerbiaSeychellesSierra LeoneSingaporeSlovak RepublicSloveniaSmall statesSolomon IslandsSomaliaSouth AfricaSouth AsiaSouth Asia (IDA & IBRD)South SudanSpainSri LankaSt. LuciaSt. Vincent and the GrenadinesSub-Saharan Africa Sub-Saharan Africa (excluding high income)Sub-Saharan Africa (IDA & IBRD countries)SudanSurinameSwazilandSwedenSwitzerlandSyrian Arab RepublicTajikistanTanzaniaThailandTimor-LesteTogoTongaTrinidad and TobagoTunisiaTurkeyTurkmenistanUgandaUkraineUnited Arab EmiratesUnited KingdomUnited StatesUpper middle incomeUruguayUzbekistanVanuatuVenezuela, RBVietnamVirgin Islands (U.S.)West Bank and GazaWorldYemen, Rep.ZambiaZimbabwe Timeline:
This timeline shows a graph from 1961 to 2016 of Lebanon. No data until 1960. Number of actual observations by date: 56.
Source name:
World Development Indicators
Source organization:
World Bank staff estimates based on age distributions of United Nations Population Division's World Population Prospects.
Categories, topics:
Health
Last updated:
apr 23, 2017
Indicators value changes by year
At the date of observation
Value
Absolute change
Change from previous value
jan 1, 1961
5.95
+5.95
0.0%
jan 1, 1962
5.842
-0.108
-1.82%
jan 1, 1963
5.698
-0.145
-2.47%
jan 1, 1964
5.54
-0.158
-2.77%
jan 1, 1965
5.396
-0.144
-2.6%
jan 1, 1966
5.279
-0.117
-2.17%
jan 1, 1967
5.219
-0.06
-1.14%
jan 1, 1968
5.171
-0.047
-0.9%
jan 1, 1969
5.134
-0.038
-0.73%
jan 1, 1970
5.095
-0.038
-0.75%
jan 1, 1971
5.049
-0.047
-0.91%
jan 1, 1972
5.034
-0.015
-0.3%
jan 1, 1973
5.005
-0.029
-0.57%
jan 1, 1974
4.97
-0.035
-0.7%
jan 1, 1975
4.941
-0.028
-0.57%
jan 1, 1976
4.926
-0.015
-0.31%
jan 1, 1977
5.044
+0.118
2.39%
jan 1, 1978
5.172
+0.128
2.54%
jan 1, 1979
5.292
+0.12
2.31%
jan 1, 1980
5.375
+0.084
1.58%
jan 1, 1981
5.407
+0.032
0.6%
jan 1, 1982
5.371
-0.036
-0.67%
jan 1, 1983
5.299
-0.072
-1.35%
jan 1, 1984
5.22
-0.079
-1.48%
jan 1, 1985
5.173
-0.048
-0.91%
jan 1, 1986
5.178
+0.005
0.1%
jan 1, 1987
5.252
+0.074
1.43%
jan 1, 1988
5.37
+0.118
2.25%
jan 1, 1989
5.528
+0.158
2.93%
jan 1, 1990
5.711
+0.184
3.32%
jan 1, 1991
5.908
+0.197
3.45%
jan 1, 1992
6.009
+0.1
1.7%
jan 1, 1993
6.104
+0.096
1.59%
jan 1, 1994
6.193
+0.088
1.45%
jan 1, 1995
6.275
+0.082
1.33%
jan 1, 1996
6.356
+0.081
1.29%
jan 1, 1997
6.492
+0.137
2.15%
jan 1, 1998
6.635
+0.142
2.19%
jan 1, 1999
6.787
+0.153
2.3%
jan 1, 2000
6.948
+0.16
2.36%
jan 1, 2001
7.108
+0.161
2.31%
jan 1, 2002
7.11
+0.002
0.03%
jan 1, 2003
7.147
+0.037
0.52%
jan 1, 2004
7.219
+0.071
1.0%
jan 1, 2005
7.325
+0.106
1.47%
jan 1, 2006
7.465
+0.14
1.91%
jan 1, 2007
7.636
+0.171
2.29%
jan 1, 2008
7.82
+0.184
2.41%
jan 1, 2009
8.017
+0.197
2.52%
jan 1, 2010
8.216
+0.199
2.48%
jan 1, 2011
8.396
+0.181
2.2%
jan 1, 2012
8.32
-0.076
-0.91%
jan 1, 2013
8.243
-0.077
-0.92%
jan 1, 2014
8.175
-0.069
-0.83%
jan 1, 2015
8.133
-0.042
-0.51%
jan 1, 2016
8.136
+0.003
0.03%
Ranking of countries by current statistics by years


Comments: