29
/
en
AIzaSyAYiBZKx7MnpbEhh9jyipgxe19OcubqV5w
April 1, 2024
212181
Niger
NER
true
2
1
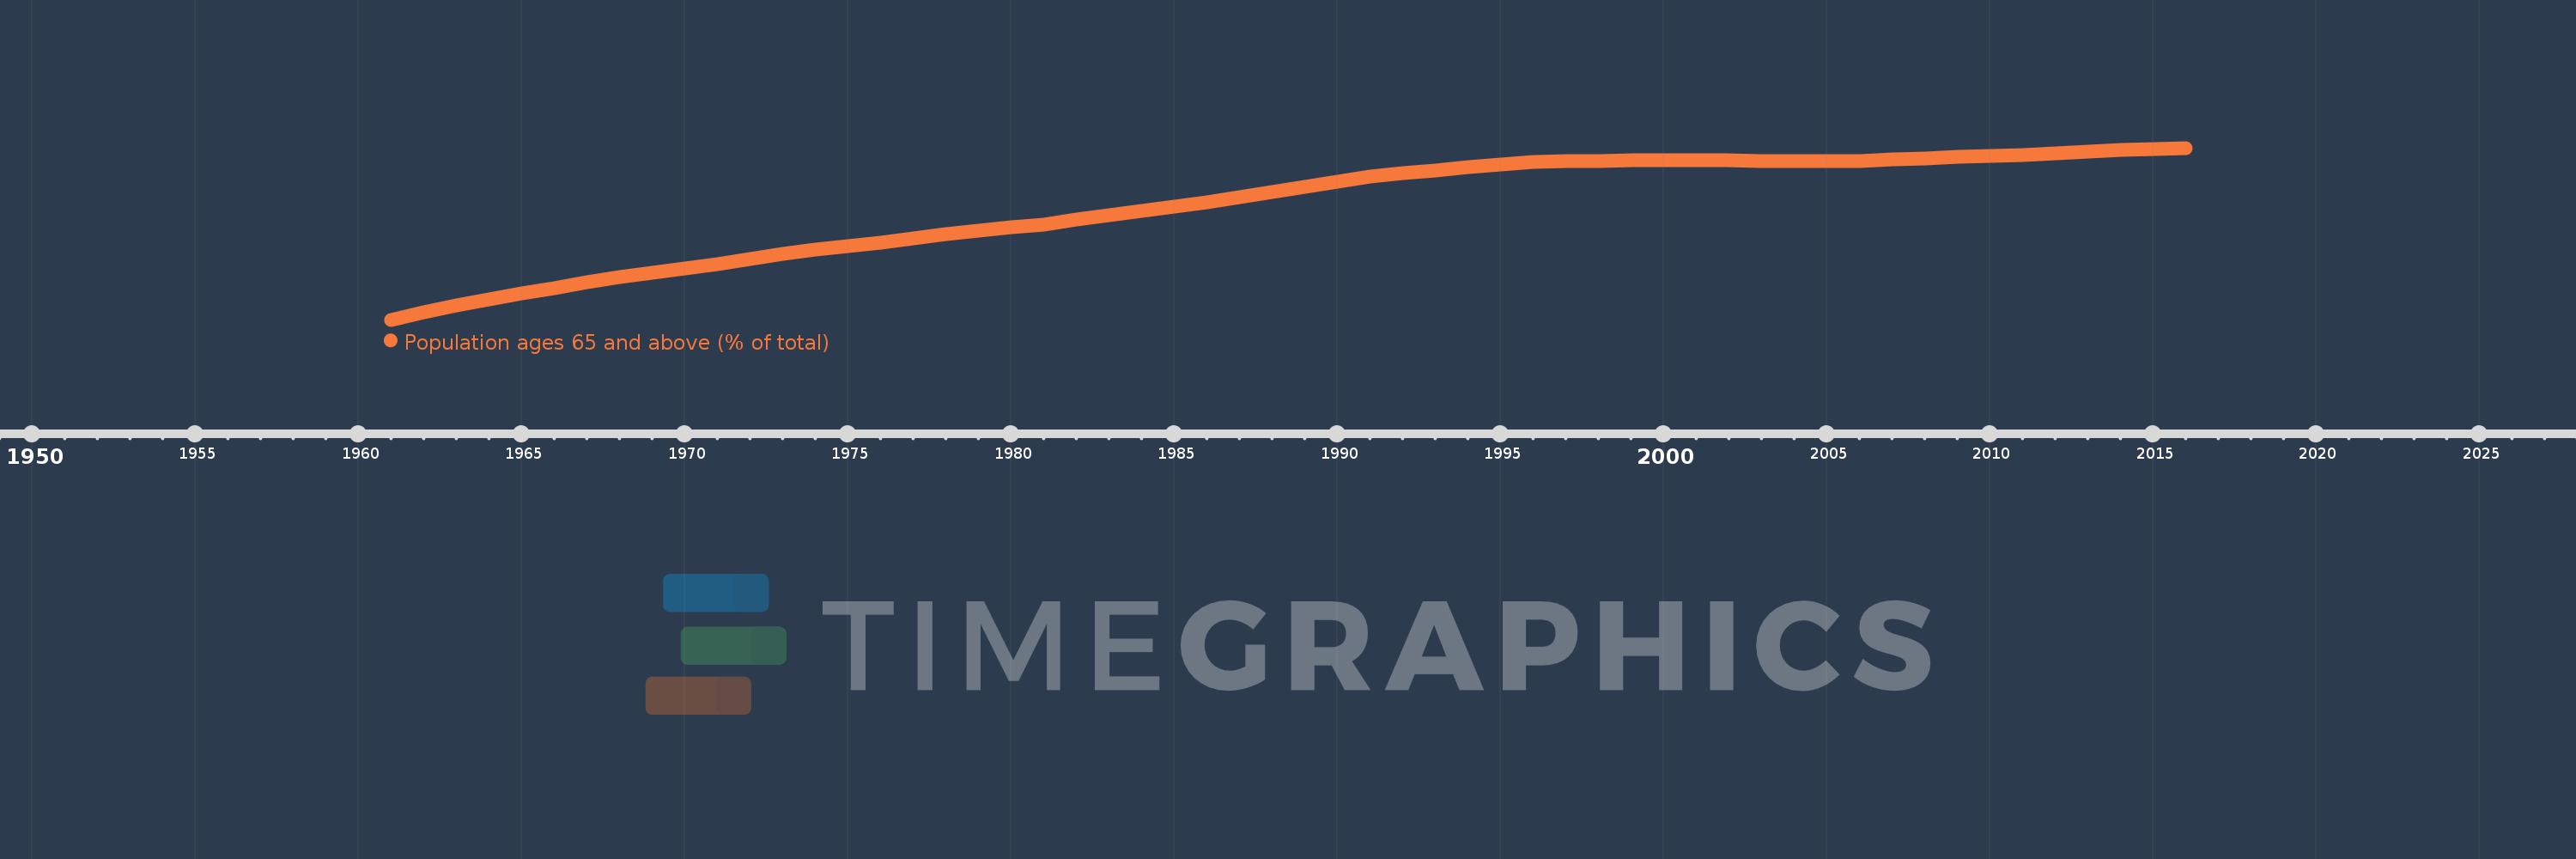
Population ages 65 and above (% of total)
2016,2015,2014,2013,2012,2011,2010,2009,2008,2007,2006,2005,2004,2003,2002,2001,2000,1999,1998,1997,1996,1995,1994,1993,1992,1991,1990,1989,1988,1987,1986,1985,1984,1983,1982,1981,1980,1979,1978,1977,1976,1975,1974,1973,1972,1971,1970,1969,1968,1967,1966,1965,1964,1963,1962,1961
This statistics in other country:
AfghanistanAlbaniaAlgeriaAngolaAntigua and BarbudaArab WorldArgentinaArmeniaArubaAustraliaAustriaAzerbaijanBahamas, TheBahrainBangladeshBarbadosBelarusBelgiumBelizeBeninBhutanBoliviaBosnia and HerzegovinaBotswanaBrazilBrunei DarussalamBulgariaBurkina FasoBurundiCabo VerdeCambodiaCameroonCanadaCaribbean small statesCentral African RepublicCentral Europe and the BalticsChadChannel IslandsChileChinaColombiaComorosCongo, Dem. Rep.Congo, Rep.Costa RicaCote d'IvoireCroatiaCubaCuracaoCyprusCzech RepublicDenmarkDjiboutiDominican RepublicEarly-demographic dividendEast Asia & PacificEast Asia & Pacific (excluding high income)East Asia & Pacific (IDA & IBRD countries)EcuadorEgypt, Arab Rep.El SalvadorEquatorial GuineaEritreaEstoniaEthiopiaEuro areaEurope & Central AsiaEurope & Central Asia (excluding high income)Europe & Central Asia (IDA & IBRD countries)European UnionFijiFinlandFragile and conflict affected situationsFranceFrench PolynesiaGabonGambia, TheGeorgiaGermanyGhanaGreeceGrenadaGuamGuatemalaGuineaGuinea-BissauGuyanaHaitiHeavily indebted poor countries (HIPC)High incomeHondurasHong Kong SAR, ChinaHungaryIBRD onlyIcelandIDA & IBRD totalIDA blendIDA onlyIDA totalIndiaIndonesiaIran, Islamic Rep.IraqIrelandIsraelItalyJamaicaJapanJordanKazakhstanKenyaKiribatiKorea, Dem. People’s Rep.Korea, Rep.KosovoKuwaitKyrgyz RepublicLao PDRLate-demographic dividendLatin America & Caribbean Latin America & Caribbean (excluding high income)Latin America & the Caribbean (IDA & IBRD countries)LatviaLeast developed countries: UN classificationLebanonLesothoLiberiaLibyaLithuaniaLow & middle incomeLow incomeLower middle incomeLuxembourgMacao SAR, ChinaMacedonia, FYRMadagascarMalawiMalaysiaMaldivesMaliMaltaMauritaniaMauritiusMexicoMicronesia, Fed. Sts.Middle East & North AfricaMiddle East & North Africa (excluding high income)Middle East & North Africa (IDA & IBRD countries)Middle incomeMoldovaMongoliaMontenegroMoroccoMozambiqueMyanmarNamibiaNepalNetherlandsNew CaledoniaNew ZealandNicaraguaNigerNigeriaNorth AmericaNorwayOECD membersOmanOther small statesPacific island small statesPakistanPanamaPapua New GuineaParaguayPeruPhilippinesPolandPortugalPost-demographic dividendPre-demographic dividendPuerto RicoQatarRomaniaRussian FederationRwandaSamoaSao Tome and PrincipeSaudi ArabiaSenegalSerbiaSeychellesSierra LeoneSingaporeSlovak RepublicSloveniaSmall statesSolomon IslandsSomaliaSouth AfricaSouth AsiaSouth Asia (IDA & IBRD)South SudanSpainSri LankaSt. LuciaSt. Vincent and the GrenadinesSub-Saharan Africa Sub-Saharan Africa (excluding high income)Sub-Saharan Africa (IDA & IBRD countries)SudanSurinameSwazilandSwedenSwitzerlandSyrian Arab RepublicTajikistanTanzaniaThailandTimor-LesteTogoTongaTrinidad and TobagoTunisiaTurkeyTurkmenistanUgandaUkraineUnited Arab EmiratesUnited KingdomUnited StatesUpper middle incomeUruguayUzbekistanVanuatuVenezuela, RBVietnamVirgin Islands (U.S.)West Bank and GazaWorldYemen, Rep.ZambiaZimbabwe Timeline:
This timeline shows a graph from 1961 to 2016 of Niger. No data until 1960. Number of actual observations by date: 56.
Source name:
World Development Indicators
Source organization:
World Bank staff estimates based on age distributions of United Nations Population Division's World Population Prospects.
Categories, topics:
Health
Last updated:
apr 23, 2017
Indicators value changes by year
At the date of observation
Value
Absolute change
Change from previous value
jan 1, 1961
1.128
+1.128
0.0%
jan 1, 1962
1.191
+0.063
5.55%
jan 1, 1963
1.248
+0.057
4.81%
jan 1, 1964
1.301
+0.052
4.19%
jan 1, 1965
1.349
+0.048
3.69%
jan 1, 1966
1.393
+0.045
3.31%
jan 1, 1967
1.442
+0.049
3.5%
jan 1, 1968
1.486
+0.044
3.05%
jan 1, 1969
1.526
+0.04
2.69%
jan 1, 1970
1.563
+0.037
2.41%
jan 1, 1971
1.597
+0.034
2.2%
jan 1, 1972
1.644
+0.047
2.92%
jan 1, 1973
1.685
+0.041
2.49%
jan 1, 1974
1.72
+0.036
2.11%
jan 1, 1975
1.751
+0.031
1.78%
jan 1, 1976
1.777
+0.026
1.51%
jan 1, 1977
1.816
+0.039
2.18%
jan 1, 1978
1.851
+0.035
1.91%
jan 1, 1979
1.882
+0.031
1.69%
jan 1, 1980
1.909
+0.028
1.46%
jan 1, 1981
1.933
+0.024
1.25%
jan 1, 1982
1.973
+0.04
2.07%
jan 1, 1983
2.011
+0.038
1.92%
jan 1, 1984
2.047
+0.036
1.79%
jan 1, 1985
2.082
+0.035
1.73%
jan 1, 1986
2.118
+0.035
1.7%
jan 1, 1987
2.163
+0.045
2.13%
jan 1, 1988
2.207
+0.044
2.05%
jan 1, 1989
2.251
+0.044
1.97%
jan 1, 1990
2.293
+0.043
1.9%
jan 1, 1991
2.335
+0.041
1.81%
jan 1, 1992
2.364
+0.029
1.25%
jan 1, 1993
2.392
+0.028
1.19%
jan 1, 1994
2.418
+0.026
1.1%
jan 1, 1995
2.442
+0.023
0.96%
jan 1, 1996
2.461
+0.02
0.8%
jan 1, 1997
2.468
+0.007
0.28%
jan 1, 1998
2.472
+0.004
0.17%
jan 1, 1999
2.475
+0.002
0.09%
jan 1, 2000
2.475
+0.001
0.03%
jan 1, 2001
2.475
0.0
-0.01%
jan 1, 2002
2.473
-0.002
-0.1%
jan 1, 2003
2.469
-0.003
-0.14%
jan 1, 2004
2.466
-0.003
-0.12%
jan 1, 2005
2.466
0.0
0.0%
jan 1, 2006
2.47
+0.004
0.15%
jan 1, 2007
2.48
+0.01
0.41%
jan 1, 2008
2.491
+0.011
0.44%
jan 1, 2009
2.502
+0.011
0.44%
jan 1, 2010
2.512
+0.01
0.39%
jan 1, 2011
2.519
+0.008
0.31%
jan 1, 2012
2.536
+0.017
0.66%
jan 1, 2013
2.551
+0.015
0.58%
jan 1, 2014
2.563
+0.013
0.49%
jan 1, 2015
2.573
+0.01
0.38%
jan 1, 2016
2.58
+0.007
0.28%
Ranking of countries by current statistics by years


Comments: