29
/
en
AIzaSyAYiBZKx7MnpbEhh9jyipgxe19OcubqV5w
April 1, 2024
24434
Arab World
ARB
false
2
1
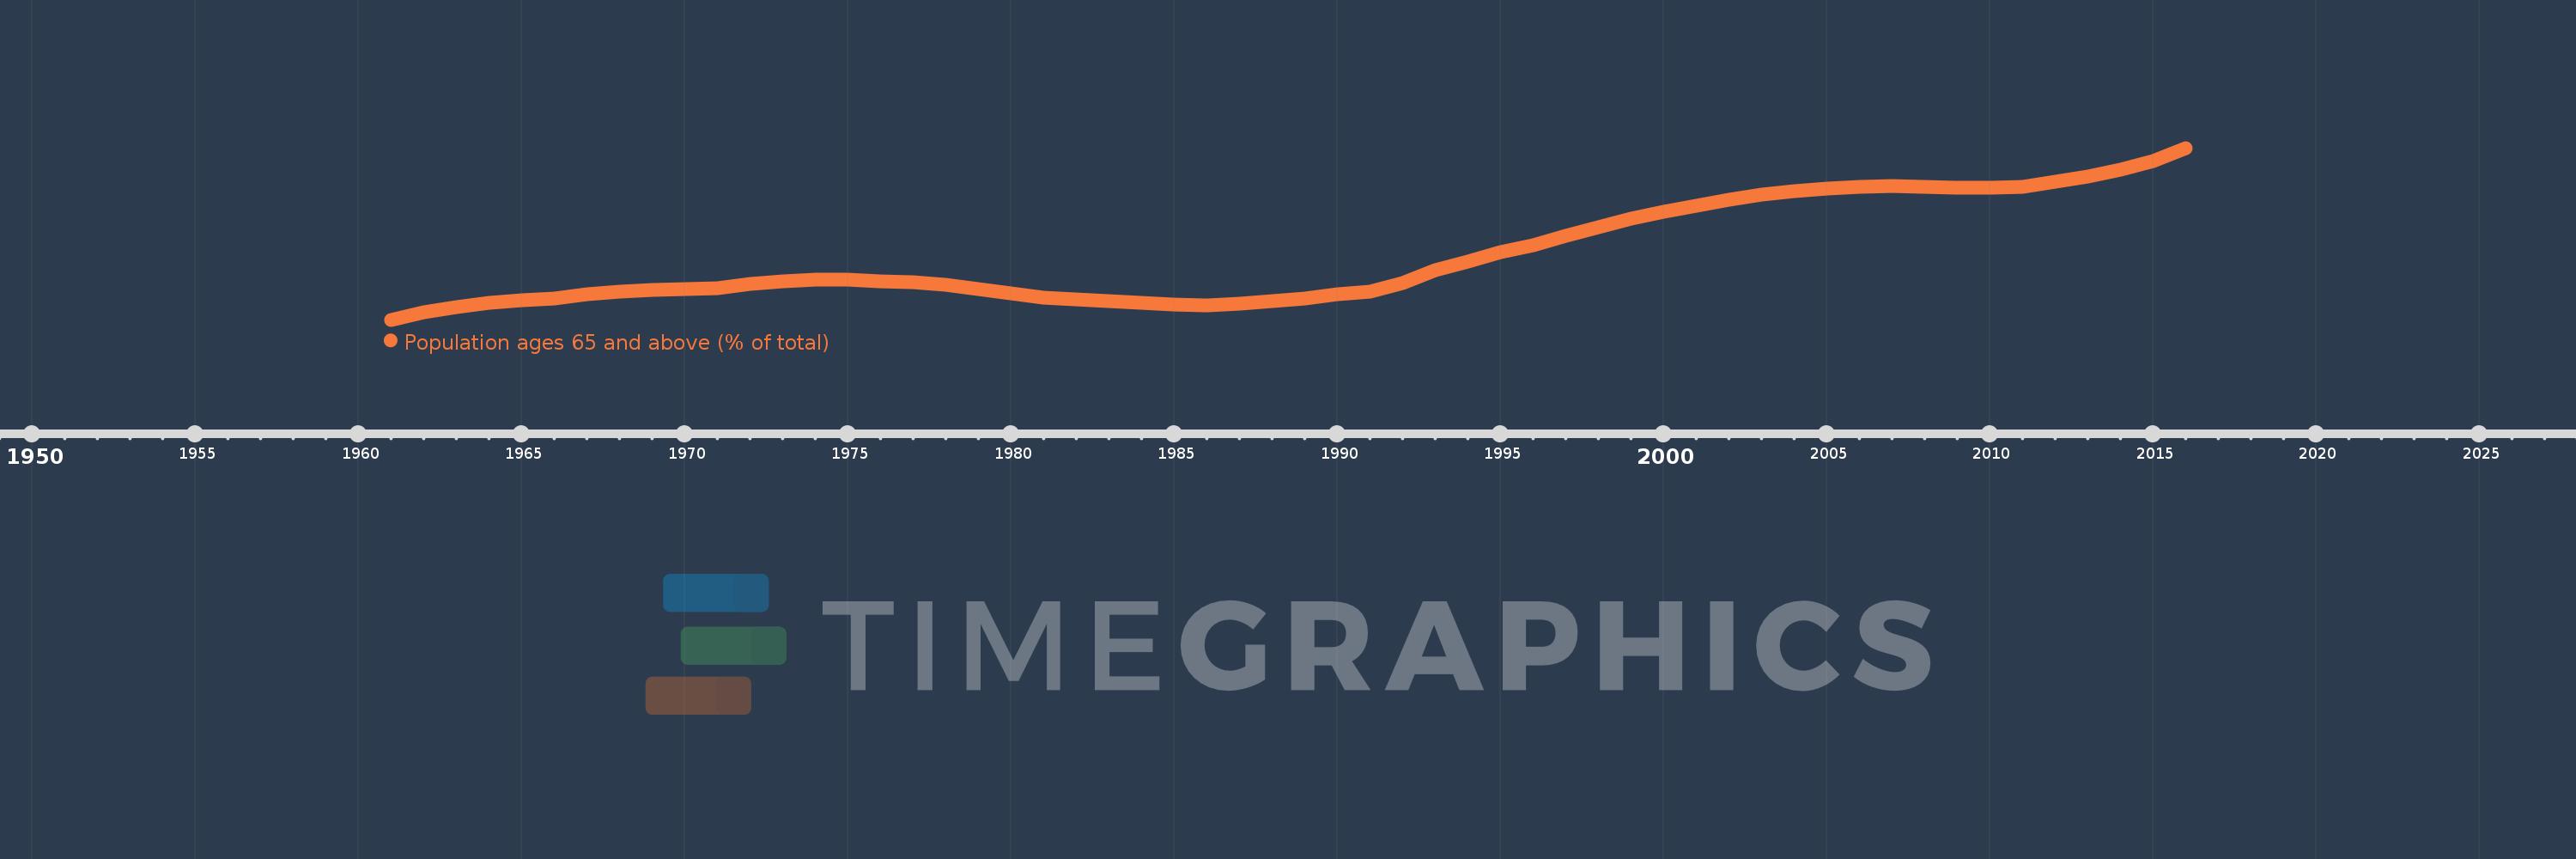
Population ages 65 and above (% of total)
2016,2015,2014,2013,2012,2011,2010,2009,2008,2007,2006,2005,2004,2003,2002,2001,2000,1999,1998,1997,1996,1995,1994,1993,1992,1991,1990,1989,1988,1987,1986,1985,1984,1983,1982,1981,1980,1979,1978,1977,1976,1975,1974,1973,1972,1971,1970,1969,1968,1967,1966,1965,1964,1963,1962,1961
This statistics in other country:
AfghanistanAlbaniaAlgeriaAngolaAntigua and BarbudaArab WorldArgentinaArmeniaArubaAustraliaAustriaAzerbaijanBahamas, TheBahrainBangladeshBarbadosBelarusBelgiumBelizeBeninBhutanBoliviaBosnia and HerzegovinaBotswanaBrazilBrunei DarussalamBulgariaBurkina FasoBurundiCabo VerdeCambodiaCameroonCanadaCaribbean small statesCentral African RepublicCentral Europe and the BalticsChadChannel IslandsChileChinaColombiaComorosCongo, Dem. Rep.Congo, Rep.Costa RicaCote d'IvoireCroatiaCubaCuracaoCyprusCzech RepublicDenmarkDjiboutiDominican RepublicEarly-demographic dividendEast Asia & PacificEast Asia & Pacific (excluding high income)East Asia & Pacific (IDA & IBRD countries)EcuadorEgypt, Arab Rep.El SalvadorEquatorial GuineaEritreaEstoniaEthiopiaEuro areaEurope & Central AsiaEurope & Central Asia (excluding high income)Europe & Central Asia (IDA & IBRD countries)European UnionFijiFinlandFragile and conflict affected situationsFranceFrench PolynesiaGabonGambia, TheGeorgiaGermanyGhanaGreeceGrenadaGuamGuatemalaGuineaGuinea-BissauGuyanaHaitiHeavily indebted poor countries (HIPC)High incomeHondurasHong Kong SAR, ChinaHungaryIBRD onlyIcelandIDA & IBRD totalIDA blendIDA onlyIDA totalIndiaIndonesiaIran, Islamic Rep.IraqIrelandIsraelItalyJamaicaJapanJordanKazakhstanKenyaKiribatiKorea, Dem. People’s Rep.Korea, Rep.KosovoKuwaitKyrgyz RepublicLao PDRLate-demographic dividendLatin America & Caribbean Latin America & Caribbean (excluding high income)Latin America & the Caribbean (IDA & IBRD countries)LatviaLeast developed countries: UN classificationLebanonLesothoLiberiaLibyaLithuaniaLow & middle incomeLow incomeLower middle incomeLuxembourgMacao SAR, ChinaMacedonia, FYRMadagascarMalawiMalaysiaMaldivesMaliMaltaMauritaniaMauritiusMexicoMicronesia, Fed. Sts.Middle East & North AfricaMiddle East & North Africa (excluding high income)Middle East & North Africa (IDA & IBRD countries)Middle incomeMoldovaMongoliaMontenegroMoroccoMozambiqueMyanmarNamibiaNepalNetherlandsNew CaledoniaNew ZealandNicaraguaNigerNigeriaNorth AmericaNorwayOECD membersOmanOther small statesPacific island small statesPakistanPanamaPapua New GuineaParaguayPeruPhilippinesPolandPortugalPost-demographic dividendPre-demographic dividendPuerto RicoQatarRomaniaRussian FederationRwandaSamoaSao Tome and PrincipeSaudi ArabiaSenegalSerbiaSeychellesSierra LeoneSingaporeSlovak RepublicSloveniaSmall statesSolomon IslandsSomaliaSouth AfricaSouth AsiaSouth Asia (IDA & IBRD)South SudanSpainSri LankaSt. LuciaSt. Vincent and the GrenadinesSub-Saharan Africa Sub-Saharan Africa (excluding high income)Sub-Saharan Africa (IDA & IBRD countries)SudanSurinameSwazilandSwedenSwitzerlandSyrian Arab RepublicTajikistanTanzaniaThailandTimor-LesteTogoTongaTrinidad and TobagoTunisiaTurkeyTurkmenistanUgandaUkraineUnited Arab EmiratesUnited KingdomUnited StatesUpper middle incomeUruguayUzbekistanVanuatuVenezuela, RBVietnamVirgin Islands (U.S.)West Bank and GazaWorldYemen, Rep.ZambiaZimbabwe Timeline:
This timeline shows a graph from 1961 to 2016 of Arab World. No data until 1960. Number of actual observations by date: 56.
Source name:
World Development Indicators
Source organization:
World Bank staff estimates based on age distributions of United Nations Population Division's World Population Prospects.
Categories, topics:
Health
Last updated:
apr 23, 2017
Indicators value changes by year
At the date of observation
Value
Absolute change
Change from previous value
jan 1, 1961
3.536
+3.536
0.0%
jan 1, 1962
3.569
+0.033
0.93%
jan 1, 1963
3.595
+0.026
0.73%
jan 1, 1964
3.615
+0.02
0.55%
jan 1, 1965
3.628
+0.013
0.37%
jan 1, 1966
3.635
+0.007
0.2%
jan 1, 1967
3.655
+0.02
0.55%
jan 1, 1968
3.668
+0.013
0.35%
jan 1, 1969
3.676
+0.008
0.21%
jan 1, 1970
3.68
+0.004
0.12%
jan 1, 1971
3.683
+0.003
0.07%
jan 1, 1972
3.7
+0.017
0.47%
jan 1, 1973
3.714
+0.014
0.37%
jan 1, 1974
3.722
+0.008
0.23%
jan 1, 1975
3.722
+0.0
0.0%
jan 1, 1976
3.713
-0.009
-0.25%
jan 1, 1977
3.71
-0.003
-0.09%
jan 1, 1978
3.697
-0.013
-0.35%
jan 1, 1979
3.678
-0.019
-0.51%
jan 1, 1980
3.658
-0.02
-0.55%
jan 1, 1981
3.639
-0.019
-0.51%
jan 1, 1982
3.632
-0.007
-0.2%
jan 1, 1983
3.623
-0.008
-0.23%
jan 1, 1984
3.615
-0.008
-0.23%
jan 1, 1985
3.607
-0.008
-0.22%
jan 1, 1986
3.602
-0.006
-0.15%
jan 1, 1987
3.611
+0.009
0.26%
jan 1, 1988
3.622
+0.011
0.3%
jan 1, 1989
3.636
+0.014
0.38%
jan 1, 1990
3.654
+0.018
0.5%
jan 1, 1991
3.665
+0.011
0.3%
jan 1, 1992
3.706
+0.041
1.12%
jan 1, 1993
3.765
+0.059
1.6%
jan 1, 1994
3.807
+0.042
1.1%
jan 1, 1995
3.85
+0.044
1.15%
jan 1, 1996
3.882
+0.032
0.82%
jan 1, 1997
3.926
+0.044
1.13%
jan 1, 1998
3.966
+0.04
1.02%
jan 1, 1999
4.003
+0.037
0.94%
jan 1, 2000
4.037
+0.034
0.84%
jan 1, 2001
4.066
+0.03
0.73%
jan 1, 2002
4.093
+0.027
0.66%
jan 1, 2003
4.116
+0.022
0.55%
jan 1, 2004
4.133
+0.018
0.43%
jan 1, 2005
4.145
+0.011
0.27%
jan 1, 2006
4.15
+0.005
0.13%
jan 1, 2007
4.155
+0.005
0.11%
jan 1, 2008
4.152
-0.002
-0.06%
jan 1, 2009
4.147
-0.005
-0.11%
jan 1, 2010
4.146
-0.001
-0.03%
jan 1, 2011
4.153
+0.006
0.15%
jan 1, 2012
4.174
+0.022
0.52%
jan 1, 2013
4.199
+0.025
0.59%
jan 1, 2014
4.23
+0.031
0.74%
jan 1, 2015
4.273
+0.043
1.02%
jan 1, 2016
4.332
+0.058
1.36%
Ranking of countries by current statistics by years


Comments: