29
/
en
AIzaSyAYiBZKx7MnpbEhh9jyipgxe19OcubqV5w
April 1, 2024
156505
Indonesia
IDN
true
2
1
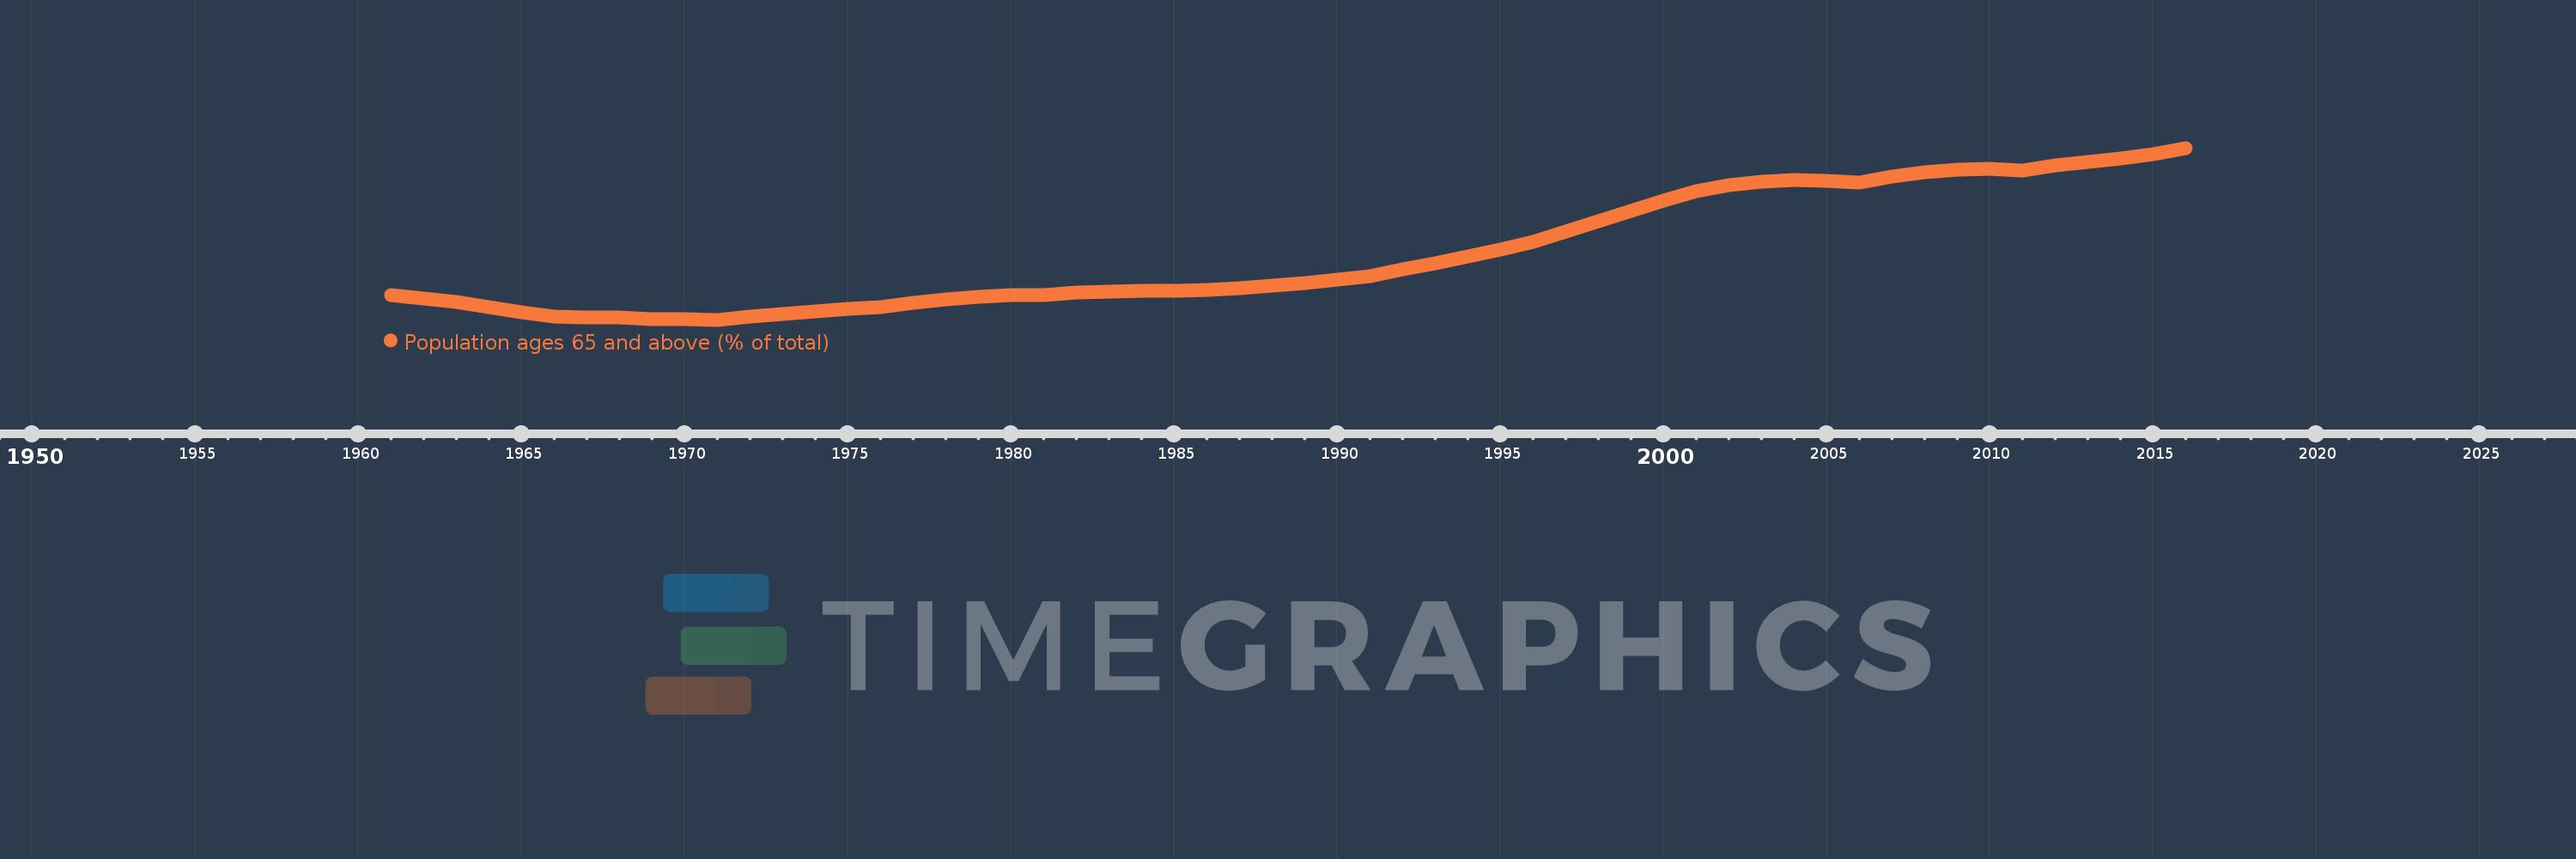
Population ages 65 and above (% of total)
2016,2015,2014,2013,2012,2011,2010,2009,2008,2007,2006,2005,2004,2003,2002,2001,2000,1999,1998,1997,1996,1995,1994,1993,1992,1991,1990,1989,1988,1987,1986,1985,1984,1983,1982,1981,1980,1979,1978,1977,1976,1975,1974,1973,1972,1971,1970,1969,1968,1967,1966,1965,1964,1963,1962,1961
This statistics in other country:
AfghanistanAlbaniaAlgeriaAngolaAntigua and BarbudaArab WorldArgentinaArmeniaArubaAustraliaAustriaAzerbaijanBahamas, TheBahrainBangladeshBarbadosBelarusBelgiumBelizeBeninBhutanBoliviaBosnia and HerzegovinaBotswanaBrazilBrunei DarussalamBulgariaBurkina FasoBurundiCabo VerdeCambodiaCameroonCanadaCaribbean small statesCentral African RepublicCentral Europe and the BalticsChadChannel IslandsChileChinaColombiaComorosCongo, Dem. Rep.Congo, Rep.Costa RicaCote d'IvoireCroatiaCubaCuracaoCyprusCzech RepublicDenmarkDjiboutiDominican RepublicEarly-demographic dividendEast Asia & PacificEast Asia & Pacific (excluding high income)East Asia & Pacific (IDA & IBRD countries)EcuadorEgypt, Arab Rep.El SalvadorEquatorial GuineaEritreaEstoniaEthiopiaEuro areaEurope & Central AsiaEurope & Central Asia (excluding high income)Europe & Central Asia (IDA & IBRD countries)European UnionFijiFinlandFragile and conflict affected situationsFranceFrench PolynesiaGabonGambia, TheGeorgiaGermanyGhanaGreeceGrenadaGuamGuatemalaGuineaGuinea-BissauGuyanaHaitiHeavily indebted poor countries (HIPC)High incomeHondurasHong Kong SAR, ChinaHungaryIBRD onlyIcelandIDA & IBRD totalIDA blendIDA onlyIDA totalIndiaIndonesiaIran, Islamic Rep.IraqIrelandIsraelItalyJamaicaJapanJordanKazakhstanKenyaKiribatiKorea, Dem. People’s Rep.Korea, Rep.KosovoKuwaitKyrgyz RepublicLao PDRLate-demographic dividendLatin America & Caribbean Latin America & Caribbean (excluding high income)Latin America & the Caribbean (IDA & IBRD countries)LatviaLeast developed countries: UN classificationLebanonLesothoLiberiaLibyaLithuaniaLow & middle incomeLow incomeLower middle incomeLuxembourgMacao SAR, ChinaMacedonia, FYRMadagascarMalawiMalaysiaMaldivesMaliMaltaMauritaniaMauritiusMexicoMicronesia, Fed. Sts.Middle East & North AfricaMiddle East & North Africa (excluding high income)Middle East & North Africa (IDA & IBRD countries)Middle incomeMoldovaMongoliaMontenegroMoroccoMozambiqueMyanmarNamibiaNepalNetherlandsNew CaledoniaNew ZealandNicaraguaNigerNigeriaNorth AmericaNorwayOECD membersOmanOther small statesPacific island small statesPakistanPanamaPapua New GuineaParaguayPeruPhilippinesPolandPortugalPost-demographic dividendPre-demographic dividendPuerto RicoQatarRomaniaRussian FederationRwandaSamoaSao Tome and PrincipeSaudi ArabiaSenegalSerbiaSeychellesSierra LeoneSingaporeSlovak RepublicSloveniaSmall statesSolomon IslandsSomaliaSouth AfricaSouth AsiaSouth Asia (IDA & IBRD)South SudanSpainSri LankaSt. LuciaSt. Vincent and the GrenadinesSub-Saharan Africa Sub-Saharan Africa (excluding high income)Sub-Saharan Africa (IDA & IBRD countries)SudanSurinameSwazilandSwedenSwitzerlandSyrian Arab RepublicTajikistanTanzaniaThailandTimor-LesteTogoTongaTrinidad and TobagoTunisiaTurkeyTurkmenistanUgandaUkraineUnited Arab EmiratesUnited KingdomUnited StatesUpper middle incomeUruguayUzbekistanVanuatuVenezuela, RBVietnamVirgin Islands (U.S.)West Bank and GazaWorldYemen, Rep.ZambiaZimbabwe Timeline:
This timeline shows a graph from 1961 to 2016 of Indonesia. No data until 1960. Number of actual observations by date: 56.
Source name:
World Development Indicators
Source organization:
World Bank staff estimates based on age distributions of United Nations Population Division's World Population Prospects.
Categories, topics:
Health
Last updated:
apr 23, 2017
Indicators value changes by year
At the date of observation
Value
Absolute change
Change from previous value
jan 1, 1961
3.584
+3.584
0.0%
jan 1, 1962
3.549
-0.035
-0.99%
jan 1, 1963
3.504
-0.045
-1.28%
jan 1, 1964
3.452
-0.051
-1.46%
jan 1, 1965
3.4
-0.052
-1.52%
jan 1, 1966
3.349
-0.051
-1.49%
jan 1, 1967
3.345
-0.004
-0.12%
jan 1, 1968
3.337
-0.008
-0.25%
jan 1, 1969
3.327
-0.01
-0.3%
jan 1, 1970
3.32
-0.008
-0.23%
jan 1, 1971
3.316
-0.003
-0.1%
jan 1, 1972
3.348
+0.032
0.97%
jan 1, 1973
3.379
+0.031
0.92%
jan 1, 1974
3.408
+0.028
0.84%
jan 1, 1975
3.431
+0.024
0.7%
jan 1, 1976
3.45
+0.019
0.55%
jan 1, 1977
3.495
+0.045
1.31%
jan 1, 1978
3.533
+0.038
1.09%
jan 1, 1979
3.563
+0.029
0.83%
jan 1, 1980
3.581
+0.018
0.51%
jan 1, 1981
3.587
+0.007
0.19%
jan 1, 1982
3.61
+0.023
0.64%
jan 1, 1983
3.622
+0.012
0.33%
jan 1, 1984
3.627
+0.005
0.14%
jan 1, 1985
3.63
+0.003
0.08%
jan 1, 1986
3.634
+0.004
0.11%
jan 1, 1987
3.661
+0.027
0.74%
jan 1, 1988
3.687
+0.026
0.7%
jan 1, 1989
3.714
+0.027
0.74%
jan 1, 1990
3.746
+0.032
0.86%
jan 1, 1991
3.785
+0.039
1.03%
jan 1, 1992
3.857
+0.073
1.92%
jan 1, 1993
3.93
+0.073
1.88%
jan 1, 1994
4.003
+0.073
1.86%
jan 1, 1995
4.077
+0.074
1.86%
jan 1, 1996
4.154
+0.077
1.88%
jan 1, 1997
4.266
+0.112
2.7%
jan 1, 1998
4.378
+0.111
2.61%
jan 1, 1999
4.489
+0.111
2.54%
jan 1, 2000
4.6
+0.111
2.47%
jan 1, 2001
4.709
+0.109
2.38%
jan 1, 2002
4.769
+0.06
1.27%
jan 1, 2003
4.809
+0.039
0.83%
jan 1, 2004
4.825
+0.017
0.35%
jan 1, 2005
4.82
-0.005
-0.1%
jan 1, 2006
4.799
-0.022
-0.45%
jan 1, 2007
4.863
+0.064
1.34%
jan 1, 2008
4.91
+0.047
0.97%
jan 1, 2009
4.939
+0.029
0.6%
jan 1, 2010
4.948
+0.009
0.18%
jan 1, 2011
4.934
-0.014
-0.29%
jan 1, 2012
4.986
+0.052
1.06%
jan 1, 2013
5.025
+0.039
0.78%
jan 1, 2014
5.062
+0.036
0.72%
jan 1, 2015
5.109
+0.047
0.93%
jan 1, 2016
5.174
+0.065
1.27%
Ranking of countries by current statistics by years


Comments: