29
/
en
AIzaSyAYiBZKx7MnpbEhh9jyipgxe19OcubqV5w
April 1, 2024
111414
Congo, Rep.
COG
true
2
1
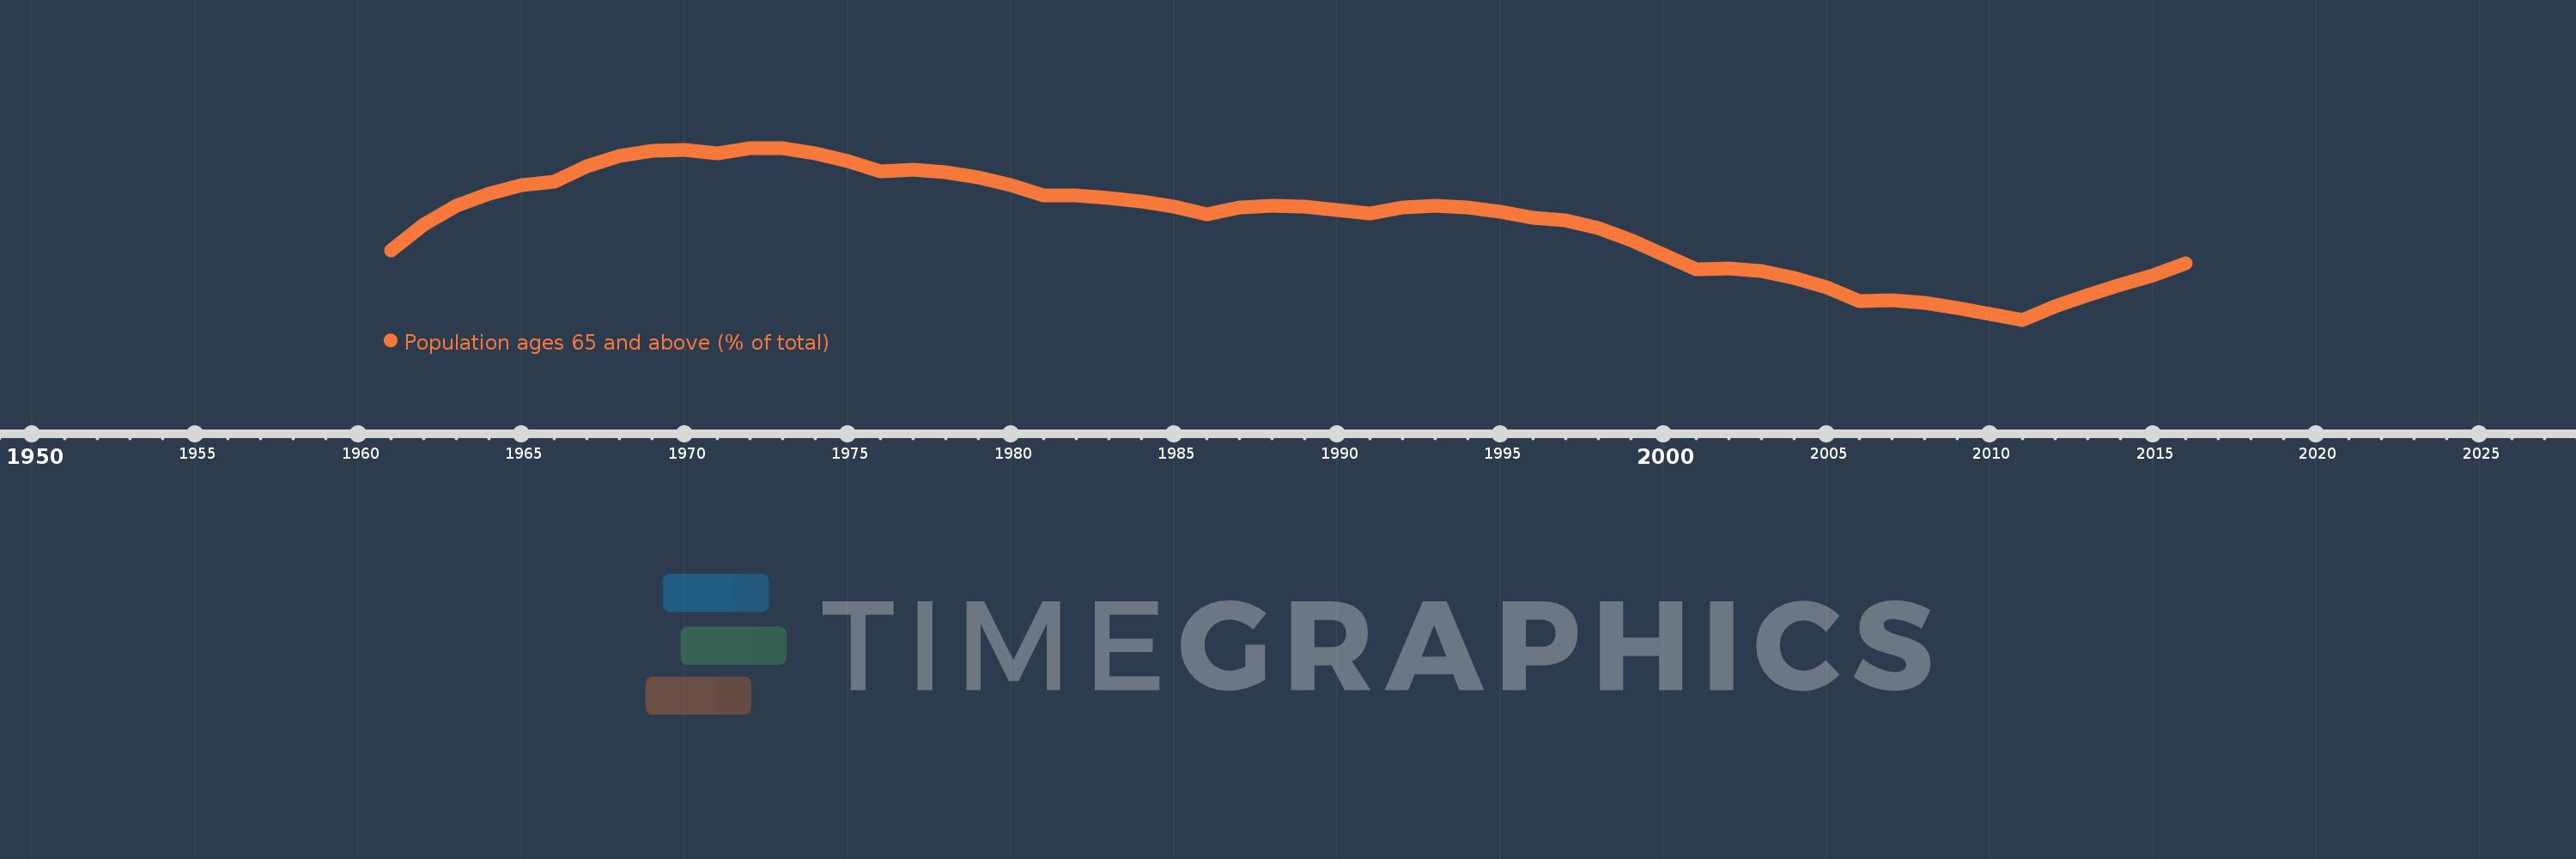
Population ages 65 and above (% of total)
2016,2015,2014,2013,2012,2011,2010,2009,2008,2007,2006,2005,2004,2003,2002,2001,2000,1999,1998,1997,1996,1995,1994,1993,1992,1991,1990,1989,1988,1987,1986,1985,1984,1983,1982,1981,1980,1979,1978,1977,1976,1975,1974,1973,1972,1971,1970,1969,1968,1967,1966,1965,1964,1963,1962,1961
This statistics in other country:
AfghanistanAlbaniaAlgeriaAngolaAntigua and BarbudaArab WorldArgentinaArmeniaArubaAustraliaAustriaAzerbaijanBahamas, TheBahrainBangladeshBarbadosBelarusBelgiumBelizeBeninBhutanBoliviaBosnia and HerzegovinaBotswanaBrazilBrunei DarussalamBulgariaBurkina FasoBurundiCabo VerdeCambodiaCameroonCanadaCaribbean small statesCentral African RepublicCentral Europe and the BalticsChadChannel IslandsChileChinaColombiaComorosCongo, Dem. Rep.Congo, Rep.Costa RicaCote d'IvoireCroatiaCubaCuracaoCyprusCzech RepublicDenmarkDjiboutiDominican RepublicEarly-demographic dividendEast Asia & PacificEast Asia & Pacific (excluding high income)East Asia & Pacific (IDA & IBRD countries)EcuadorEgypt, Arab Rep.El SalvadorEquatorial GuineaEritreaEstoniaEthiopiaEuro areaEurope & Central AsiaEurope & Central Asia (excluding high income)Europe & Central Asia (IDA & IBRD countries)European UnionFijiFinlandFragile and conflict affected situationsFranceFrench PolynesiaGabonGambia, TheGeorgiaGermanyGhanaGreeceGrenadaGuamGuatemalaGuineaGuinea-BissauGuyanaHaitiHeavily indebted poor countries (HIPC)High incomeHondurasHong Kong SAR, ChinaHungaryIBRD onlyIcelandIDA & IBRD totalIDA blendIDA onlyIDA totalIndiaIndonesiaIran, Islamic Rep.IraqIrelandIsraelItalyJamaicaJapanJordanKazakhstanKenyaKiribatiKorea, Dem. People’s Rep.Korea, Rep.KosovoKuwaitKyrgyz RepublicLao PDRLate-demographic dividendLatin America & Caribbean Latin America & Caribbean (excluding high income)Latin America & the Caribbean (IDA & IBRD countries)LatviaLeast developed countries: UN classificationLebanonLesothoLiberiaLibyaLithuaniaLow & middle incomeLow incomeLower middle incomeLuxembourgMacao SAR, ChinaMacedonia, FYRMadagascarMalawiMalaysiaMaldivesMaliMaltaMauritaniaMauritiusMexicoMicronesia, Fed. Sts.Middle East & North AfricaMiddle East & North Africa (excluding high income)Middle East & North Africa (IDA & IBRD countries)Middle incomeMoldovaMongoliaMontenegroMoroccoMozambiqueMyanmarNamibiaNepalNetherlandsNew CaledoniaNew ZealandNicaraguaNigerNigeriaNorth AmericaNorwayOECD membersOmanOther small statesPacific island small statesPakistanPanamaPapua New GuineaParaguayPeruPhilippinesPolandPortugalPost-demographic dividendPre-demographic dividendPuerto RicoQatarRomaniaRussian FederationRwandaSamoaSao Tome and PrincipeSaudi ArabiaSenegalSerbiaSeychellesSierra LeoneSingaporeSlovak RepublicSloveniaSmall statesSolomon IslandsSomaliaSouth AfricaSouth AsiaSouth Asia (IDA & IBRD)South SudanSpainSri LankaSt. LuciaSt. Vincent and the GrenadinesSub-Saharan Africa Sub-Saharan Africa (excluding high income)Sub-Saharan Africa (IDA & IBRD countries)SudanSurinameSwazilandSwedenSwitzerlandSyrian Arab RepublicTajikistanTanzaniaThailandTimor-LesteTogoTongaTrinidad and TobagoTunisiaTurkeyTurkmenistanUgandaUkraineUnited Arab EmiratesUnited KingdomUnited StatesUpper middle incomeUruguayUzbekistanVanuatuVenezuela, RBVietnamVirgin Islands (U.S.)West Bank and GazaWorldYemen, Rep.ZambiaZimbabwe Timeline:
This timeline shows a graph from 1961 to 2016 of Congo, Rep.. No data until 1960. Number of actual observations by date: 56.
Source name:
World Development Indicators
Source organization:
World Bank staff estimates based on age distributions of United Nations Population Division's World Population Prospects.
Categories, topics:
Health
Last updated:
apr 23, 2017
Indicators value changes by year
At the date of observation
Value
Absolute change
Change from previous value
jan 1, 1961
3.675
+3.675
0.0%
jan 1, 1962
3.704
+0.029
0.79%
jan 1, 1963
3.725
+0.021
0.57%
jan 1, 1964
3.739
+0.014
0.38%
jan 1, 1965
3.748
+0.009
0.24%
jan 1, 1966
3.752
+0.004
0.11%
jan 1, 1967
3.77
+0.018
0.47%
jan 1, 1968
3.781
+0.011
0.3%
jan 1, 1969
3.787
+0.006
0.16%
jan 1, 1970
3.788
+0.001
0.02%
jan 1, 1971
3.784
-0.004
-0.1%
jan 1, 1972
3.79
+0.006
0.16%
jan 1, 1973
3.79
-0.001
-0.02%
jan 1, 1974
3.784
-0.006
-0.15%
jan 1, 1975
3.775
-0.009
-0.24%
jan 1, 1976
3.764
-0.011
-0.3%
jan 1, 1977
3.766
+0.002
0.06%
jan 1, 1978
3.763
-0.003
-0.07%
jan 1, 1979
3.757
-0.007
-0.18%
jan 1, 1980
3.748
-0.009
-0.24%
jan 1, 1981
3.737
-0.01
-0.28%
jan 1, 1982
3.737
0.0
-0.01%
jan 1, 1983
3.734
-0.003
-0.07%
jan 1, 1984
3.73
-0.005
-0.12%
jan 1, 1985
3.724
-0.006
-0.17%
jan 1, 1986
3.716
-0.007
-0.2%
jan 1, 1987
3.723
+0.007
0.18%
jan 1, 1988
3.725
+0.002
0.05%
jan 1, 1989
3.724
-0.001
-0.03%
jan 1, 1990
3.721
-0.003
-0.08%
jan 1, 1991
3.717
-0.003
-0.09%
jan 1, 1992
3.723
+0.006
0.15%
jan 1, 1993
3.725
+0.002
0.05%
jan 1, 1994
3.723
-0.001
-0.04%
jan 1, 1995
3.719
-0.004
-0.12%
jan 1, 1996
3.712
-0.007
-0.19%
jan 1, 1997
3.709
-0.003
-0.07%
jan 1, 1998
3.7
-0.009
-0.24%
jan 1, 1999
3.687
-0.014
-0.37%
jan 1, 2000
3.671
-0.016
-0.43%
jan 1, 2001
3.654
-0.016
-0.45%
jan 1, 2002
3.655
+0.001
0.02%
jan 1, 2003
3.652
-0.003
-0.08%
jan 1, 2004
3.645
-0.007
-0.18%
jan 1, 2005
3.634
-0.011
-0.3%
jan 1, 2006
3.619
-0.015
-0.42%
jan 1, 2007
3.62
+0.001
0.03%
jan 1, 2008
3.617
-0.003
-0.08%
jan 1, 2009
3.611
-0.006
-0.16%
jan 1, 2010
3.604
-0.007
-0.19%
jan 1, 2011
3.598
-0.006
-0.18%
jan 1, 2012
3.613
+0.015
0.43%
jan 1, 2013
3.626
+0.013
0.35%
jan 1, 2014
3.637
+0.011
0.31%
jan 1, 2015
3.648
+0.011
0.31%
jan 1, 2016
3.661
+0.013
0.34%
Ranking of countries by current statistics by years


Comments: