29
/
en
AIzaSyAYiBZKx7MnpbEhh9jyipgxe19OcubqV5w
April 1, 2024
167992
Kenya
KEN
true
2
1
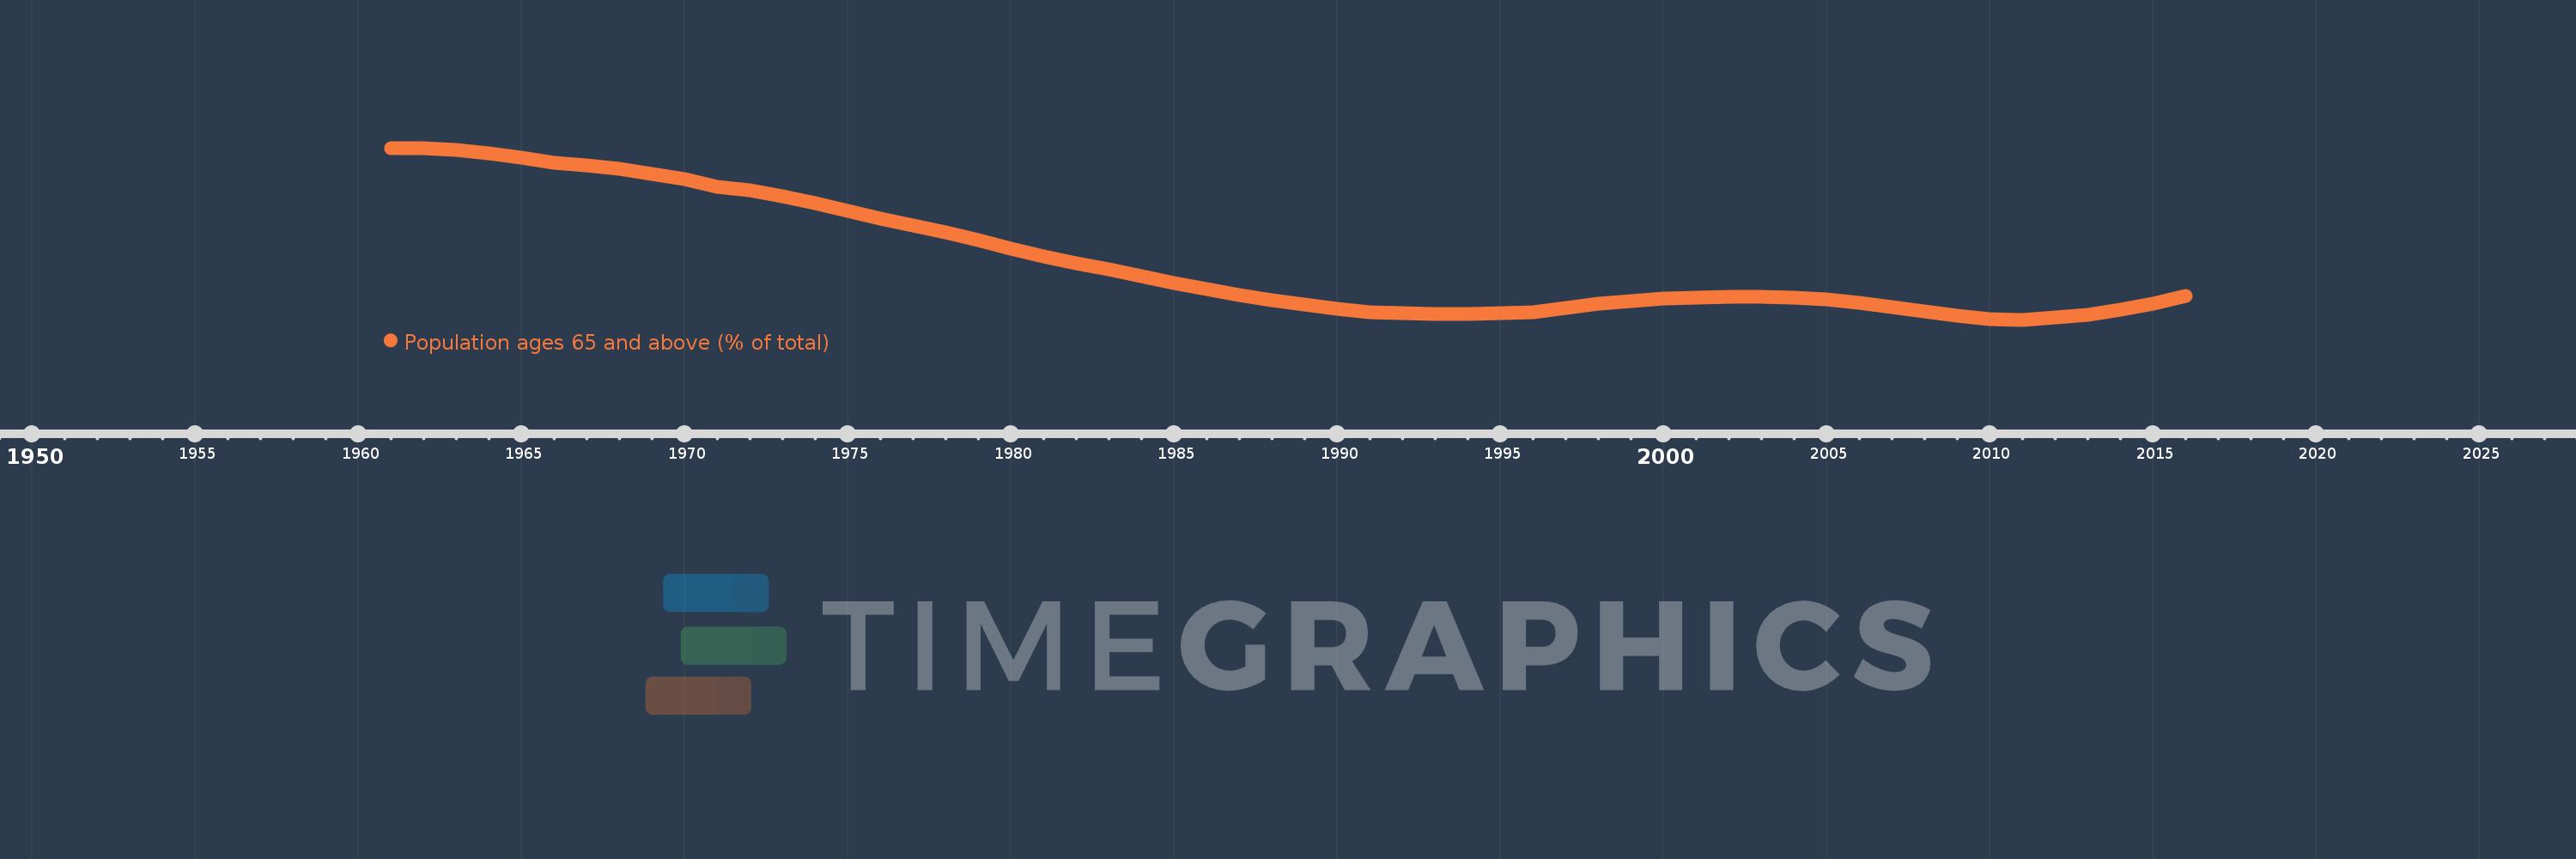
Population ages 65 and above (% of total)
2016,2015,2014,2013,2012,2011,2010,2009,2008,2007,2006,2005,2004,2003,2002,2001,2000,1999,1998,1997,1996,1995,1994,1993,1992,1991,1990,1989,1988,1987,1986,1985,1984,1983,1982,1981,1980,1979,1978,1977,1976,1975,1974,1973,1972,1971,1970,1969,1968,1967,1966,1965,1964,1963,1962,1961
This statistics in other country:
AfghanistanAlbaniaAlgeriaAngolaAntigua and BarbudaArab WorldArgentinaArmeniaArubaAustraliaAustriaAzerbaijanBahamas, TheBahrainBangladeshBarbadosBelarusBelgiumBelizeBeninBhutanBoliviaBosnia and HerzegovinaBotswanaBrazilBrunei DarussalamBulgariaBurkina FasoBurundiCabo VerdeCambodiaCameroonCanadaCaribbean small statesCentral African RepublicCentral Europe and the BalticsChadChannel IslandsChileChinaColombiaComorosCongo, Dem. Rep.Congo, Rep.Costa RicaCote d'IvoireCroatiaCubaCuracaoCyprusCzech RepublicDenmarkDjiboutiDominican RepublicEarly-demographic dividendEast Asia & PacificEast Asia & Pacific (excluding high income)East Asia & Pacific (IDA & IBRD countries)EcuadorEgypt, Arab Rep.El SalvadorEquatorial GuineaEritreaEstoniaEthiopiaEuro areaEurope & Central AsiaEurope & Central Asia (excluding high income)Europe & Central Asia (IDA & IBRD countries)European UnionFijiFinlandFragile and conflict affected situationsFranceFrench PolynesiaGabonGambia, TheGeorgiaGermanyGhanaGreeceGrenadaGuamGuatemalaGuineaGuinea-BissauGuyanaHaitiHeavily indebted poor countries (HIPC)High incomeHondurasHong Kong SAR, ChinaHungaryIBRD onlyIcelandIDA & IBRD totalIDA blendIDA onlyIDA totalIndiaIndonesiaIran, Islamic Rep.IraqIrelandIsraelItalyJamaicaJapanJordanKazakhstanKenyaKiribatiKorea, Dem. People’s Rep.Korea, Rep.KosovoKuwaitKyrgyz RepublicLao PDRLate-demographic dividendLatin America & Caribbean Latin America & Caribbean (excluding high income)Latin America & the Caribbean (IDA & IBRD countries)LatviaLeast developed countries: UN classificationLebanonLesothoLiberiaLibyaLithuaniaLow & middle incomeLow incomeLower middle incomeLuxembourgMacao SAR, ChinaMacedonia, FYRMadagascarMalawiMalaysiaMaldivesMaliMaltaMauritaniaMauritiusMexicoMicronesia, Fed. Sts.Middle East & North AfricaMiddle East & North Africa (excluding high income)Middle East & North Africa (IDA & IBRD countries)Middle incomeMoldovaMongoliaMontenegroMoroccoMozambiqueMyanmarNamibiaNepalNetherlandsNew CaledoniaNew ZealandNicaraguaNigerNigeriaNorth AmericaNorwayOECD membersOmanOther small statesPacific island small statesPakistanPanamaPapua New GuineaParaguayPeruPhilippinesPolandPortugalPost-demographic dividendPre-demographic dividendPuerto RicoQatarRomaniaRussian FederationRwandaSamoaSao Tome and PrincipeSaudi ArabiaSenegalSerbiaSeychellesSierra LeoneSingaporeSlovak RepublicSloveniaSmall statesSolomon IslandsSomaliaSouth AfricaSouth AsiaSouth Asia (IDA & IBRD)South SudanSpainSri LankaSt. LuciaSt. Vincent and the GrenadinesSub-Saharan Africa Sub-Saharan Africa (excluding high income)Sub-Saharan Africa (IDA & IBRD countries)SudanSurinameSwazilandSwedenSwitzerlandSyrian Arab RepublicTajikistanTanzaniaThailandTimor-LesteTogoTongaTrinidad and TobagoTunisiaTurkeyTurkmenistanUgandaUkraineUnited Arab EmiratesUnited KingdomUnited StatesUpper middle incomeUruguayUzbekistanVanuatuVenezuela, RBVietnamVirgin Islands (U.S.)West Bank and GazaWorldYemen, Rep.ZambiaZimbabwe Timeline:
This timeline shows a graph from 1961 to 2016 of Kenya. No data until 1960. Number of actual observations by date: 56.
Source name:
World Development Indicators
Source organization:
World Bank staff estimates based on age distributions of United Nations Population Division's World Population Prospects.
Categories, topics:
Health
Last updated:
apr 23, 2017
Indicators value changes by year
At the date of observation
Value
Absolute change
Change from previous value
jan 1, 1961
3.677
+3.677
0.0%
jan 1, 1962
3.676
-0.002
-0.04%
jan 1, 1963
3.665
-0.011
-0.3%
jan 1, 1964
3.646
-0.019
-0.5%
jan 1, 1965
3.622
-0.025
-0.68%
jan 1, 1966
3.591
-0.031
-0.84%
jan 1, 1967
3.575
-0.016
-0.44%
jan 1, 1968
3.553
-0.022
-0.62%
jan 1, 1969
3.525
-0.028
-0.8%
jan 1, 1970
3.49
-0.035
-0.99%
jan 1, 1971
3.449
-0.041
-1.18%
jan 1, 1972
3.424
-0.025
-0.74%
jan 1, 1973
3.391
-0.033
-0.96%
jan 1, 1974
3.351
-0.04
-1.17%
jan 1, 1975
3.306
-0.045
-1.34%
jan 1, 1976
3.257
-0.049
-1.48%
jan 1, 1977
3.218
-0.039
-1.19%
jan 1, 1978
3.176
-0.042
-1.31%
jan 1, 1979
3.131
-0.045
-1.42%
jan 1, 1980
3.083
-0.048
-1.54%
jan 1, 1981
3.033
-0.05
-1.63%
jan 1, 1982
2.996
-0.036
-1.19%
jan 1, 1983
2.957
-0.039
-1.3%
jan 1, 1984
2.917
-0.04
-1.36%
jan 1, 1985
2.877
-0.04
-1.37%
jan 1, 1986
2.839
-0.038
-1.33%
jan 1, 1987
2.808
-0.031
-1.09%
jan 1, 1988
2.777
-0.031
-1.1%
jan 1, 1989
2.748
-0.029
-1.03%
jan 1, 1990
2.724
-0.024
-0.88%
jan 1, 1991
2.706
-0.018
-0.67%
jan 1, 1992
2.699
-0.007
-0.26%
jan 1, 1993
2.695
-0.003
-0.12%
jan 1, 1994
2.696
+0.0
0.01%
jan 1, 1995
2.699
+0.003
0.12%
jan 1, 1996
2.705
+0.006
0.22%
jan 1, 1997
2.732
+0.027
1.02%
jan 1, 1998
2.755
+0.023
0.83%
jan 1, 1999
2.772
+0.018
0.64%
jan 1, 2000
2.784
+0.011
0.41%
jan 1, 2001
2.789
+0.005
0.17%
jan 1, 2002
2.794
+0.006
0.21%
jan 1, 2003
2.795
+0.001
0.04%
jan 1, 2004
2.791
-0.005
-0.17%
jan 1, 2005
2.778
-0.012
-0.45%
jan 1, 2006
2.758
-0.02
-0.71%
jan 1, 2007
2.736
-0.023
-0.82%
jan 1, 2008
2.709
-0.027
-0.99%
jan 1, 2009
2.683
-0.026
-0.96%
jan 1, 2010
2.665
-0.018
-0.65%
jan 1, 2011
2.66
-0.005
-0.19%
jan 1, 2012
2.672
+0.011
0.43%
jan 1, 2013
2.691
+0.02
0.74%
jan 1, 2014
2.72
+0.028
1.05%
jan 1, 2015
2.757
+0.037
1.36%
jan 1, 2016
2.802
+0.046
1.66%
Ranking of countries by current statistics by years


Comments: