29
/
en
AIzaSyAYiBZKx7MnpbEhh9jyipgxe19OcubqV5w
April 1, 2024
150889
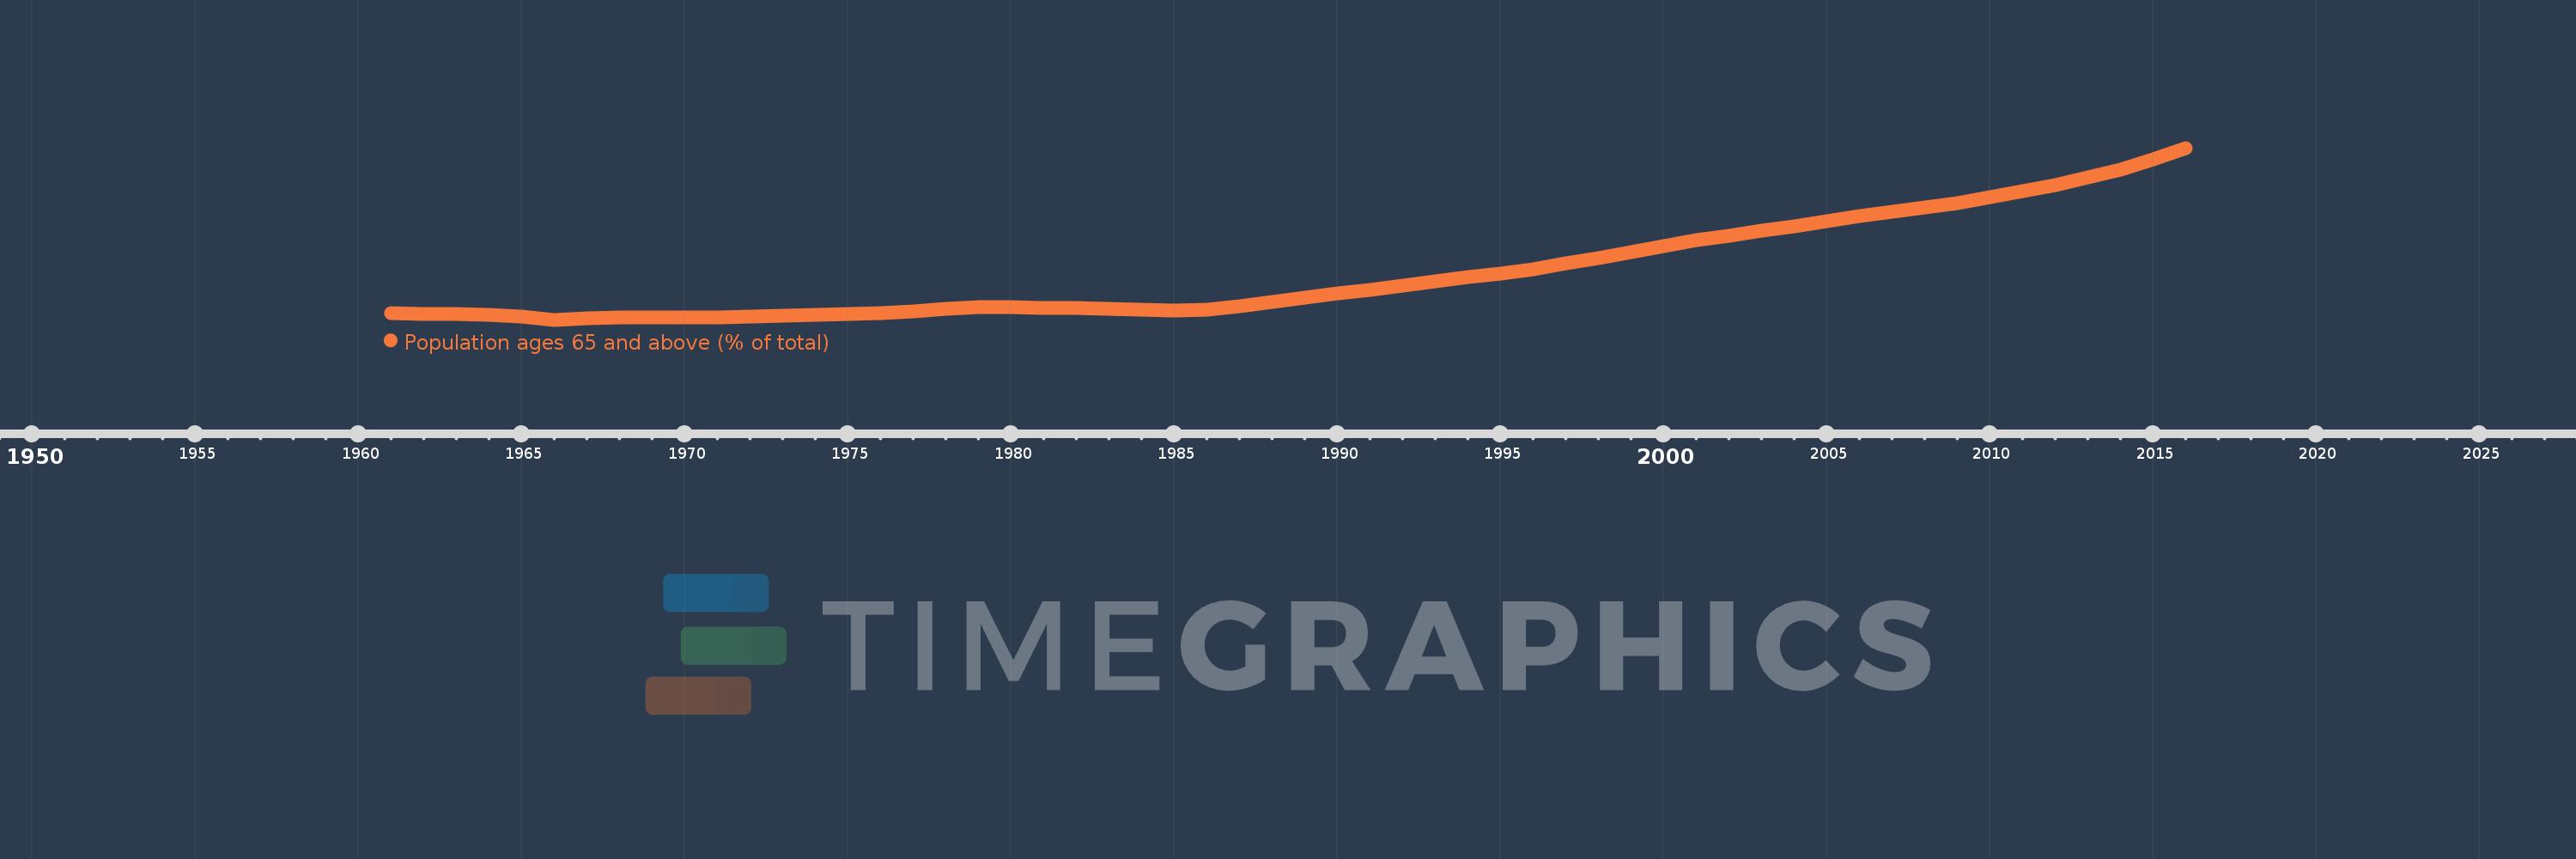
Honduras
HND
true
2
1
Population ages 65 and above (% of total)
2016,2015,2014,2013,2012,2011,2010,2009,2008,2007,2006,2005,2004,2003,2002,2001,2000,1999,1998,1997,1996,1995,1994,1993,1992,1991,1990,1989,1988,1987,1986,1985,1984,1983,1982,1981,1980,1979,1978,1977,1976,1975,1974,1973,1972,1971,1970,1969,1968,1967,1966,1965,1964,1963,1962,1961
This statistics in other country:
AfghanistanAlbaniaAlgeriaAngolaAntigua and BarbudaArab WorldArgentinaArmeniaArubaAustraliaAustriaAzerbaijanBahamas, TheBahrainBangladeshBarbadosBelarusBelgiumBelizeBeninBhutanBoliviaBosnia and HerzegovinaBotswanaBrazilBrunei DarussalamBulgariaBurkina FasoBurundiCabo VerdeCambodiaCameroonCanadaCaribbean small statesCentral African RepublicCentral Europe and the BalticsChadChannel IslandsChileChinaColombiaComorosCongo, Dem. Rep.Congo, Rep.Costa RicaCote d'IvoireCroatiaCubaCuracaoCyprusCzech RepublicDenmarkDjiboutiDominican RepublicEarly-demographic dividendEast Asia & PacificEast Asia & Pacific (excluding high income)East Asia & Pacific (IDA & IBRD countries)EcuadorEgypt, Arab Rep.El SalvadorEquatorial GuineaEritreaEstoniaEthiopiaEuro areaEurope & Central AsiaEurope & Central Asia (excluding high income)Europe & Central Asia (IDA & IBRD countries)European UnionFijiFinlandFragile and conflict affected situationsFranceFrench PolynesiaGabonGambia, TheGeorgiaGermanyGhanaGreeceGrenadaGuamGuatemalaGuineaGuinea-BissauGuyanaHaitiHeavily indebted poor countries (HIPC)High incomeHondurasHong Kong SAR, ChinaHungaryIBRD onlyIcelandIDA & IBRD totalIDA blendIDA onlyIDA totalIndiaIndonesiaIran, Islamic Rep.IraqIrelandIsraelItalyJamaicaJapanJordanKazakhstanKenyaKiribatiKorea, Dem. People’s Rep.Korea, Rep.KosovoKuwaitKyrgyz RepublicLao PDRLate-demographic dividendLatin America & Caribbean Latin America & Caribbean (excluding high income)Latin America & the Caribbean (IDA & IBRD countries)LatviaLeast developed countries: UN classificationLebanonLesothoLiberiaLibyaLithuaniaLow & middle incomeLow incomeLower middle incomeLuxembourgMacao SAR, ChinaMacedonia, FYRMadagascarMalawiMalaysiaMaldivesMaliMaltaMauritaniaMauritiusMexicoMicronesia, Fed. Sts.Middle East & North AfricaMiddle East & North Africa (excluding high income)Middle East & North Africa (IDA & IBRD countries)Middle incomeMoldovaMongoliaMontenegroMoroccoMozambiqueMyanmarNamibiaNepalNetherlandsNew CaledoniaNew ZealandNicaraguaNigerNigeriaNorth AmericaNorwayOECD membersOmanOther small statesPacific island small statesPakistanPanamaPapua New GuineaParaguayPeruPhilippinesPolandPortugalPost-demographic dividendPre-demographic dividendPuerto RicoQatarRomaniaRussian FederationRwandaSamoaSao Tome and PrincipeSaudi ArabiaSenegalSerbiaSeychellesSierra LeoneSingaporeSlovak RepublicSloveniaSmall statesSolomon IslandsSomaliaSouth AfricaSouth AsiaSouth Asia (IDA & IBRD)South SudanSpainSri LankaSt. LuciaSt. Vincent and the GrenadinesSub-Saharan Africa Sub-Saharan Africa (excluding high income)Sub-Saharan Africa (IDA & IBRD countries)SudanSurinameSwazilandSwedenSwitzerlandSyrian Arab RepublicTajikistanTanzaniaThailandTimor-LesteTogoTongaTrinidad and TobagoTunisiaTurkeyTurkmenistanUgandaUkraineUnited Arab EmiratesUnited KingdomUnited StatesUpper middle incomeUruguayUzbekistanVanuatuVenezuela, RBVietnamVirgin Islands (U.S.)West Bank and GazaWorldYemen, Rep.ZambiaZimbabwe Timeline:
This timeline shows a graph from 1961 to 2016 of Honduras. No data until 1960. Number of actual observations by date: 56.
Source name:
World Development Indicators
Source organization:
World Bank staff estimates based on age distributions of United Nations Population Division's World Population Prospects.
Categories, topics:
Health
Last updated:
apr 23, 2017
Indicators value changes by year
At the date of observation
Value
Absolute change
Change from previous value
jan 1, 1961
3.168
+3.168
0.0%
jan 1, 1962
3.164
-0.004
-0.13%
jan 1, 1963
3.159
-0.005
-0.16%
jan 1, 1964
3.149
-0.01
-0.32%
jan 1, 1965
3.13
-0.019
-0.61%
jan 1, 1966
3.101
-0.029
-0.93%
jan 1, 1967
3.118
+0.017
0.55%
jan 1, 1968
3.126
+0.008
0.26%
jan 1, 1969
3.128
+0.002
0.05%
jan 1, 1970
3.126
-0.002
-0.06%
jan 1, 1971
3.122
-0.004
-0.12%
jan 1, 1972
3.133
+0.011
0.35%
jan 1, 1973
3.142
+0.009
0.3%
jan 1, 1974
3.15
+0.008
0.25%
jan 1, 1975
3.158
+0.008
0.24%
jan 1, 1976
3.165
+0.007
0.23%
jan 1, 1977
3.189
+0.024
0.76%
jan 1, 1978
3.21
+0.021
0.67%
jan 1, 1979
3.226
+0.016
0.49%
jan 1, 1980
3.231
+0.005
0.16%
jan 1, 1981
3.224
-0.006
-0.2%
jan 1, 1982
3.222
-0.003
-0.09%
jan 1, 1983
3.211
-0.01
-0.33%
jan 1, 1984
3.2
-0.012
-0.36%
jan 1, 1985
3.196
-0.004
-0.12%
jan 1, 1986
3.204
+0.009
0.27%
jan 1, 1987
3.237
+0.033
1.03%
jan 1, 1988
3.279
+0.042
1.29%
jan 1, 1989
3.325
+0.046
1.39%
jan 1, 1990
3.368
+0.044
1.31%
jan 1, 1991
3.407
+0.039
1.15%
jan 1, 1992
3.453
+0.046
1.36%
jan 1, 1993
3.494
+0.041
1.18%
jan 1, 1994
3.532
+0.038
1.1%
jan 1, 1995
3.573
+0.041
1.15%
jan 1, 1996
3.618
+0.045
1.26%
jan 1, 1997
3.673
+0.056
1.54%
jan 1, 1998
3.732
+0.059
1.61%
jan 1, 1999
3.793
+0.061
1.63%
jan 1, 2000
3.853
+0.06
1.58%
jan 1, 2001
3.911
+0.058
1.51%
jan 1, 2002
3.96
+0.048
1.24%
jan 1, 2003
4.008
+0.048
1.22%
jan 1, 2004
4.057
+0.049
1.21%
jan 1, 2005
4.105
+0.049
1.2%
jan 1, 2006
4.154
+0.049
1.2%
jan 1, 2007
4.198
+0.044
1.05%
jan 1, 2008
4.243
+0.045
1.07%
jan 1, 2009
4.292
+0.049
1.15%
jan 1, 2010
4.347
+0.056
1.3%
jan 1, 2011
4.413
+0.066
1.51%
jan 1, 2012
4.477
+0.064
1.45%
jan 1, 2013
4.55
+0.073
1.63%
jan 1, 2014
4.635
+0.085
1.87%
jan 1, 2015
4.736
+0.101
2.18%
jan 1, 2016
4.853
+0.117
2.48%
Ranking of countries by current statistics by years


Comments: