29
/
en
AIzaSyAYiBZKx7MnpbEhh9jyipgxe19OcubqV5w
April 1, 2024
149569
Haiti
HTI
true
2
1
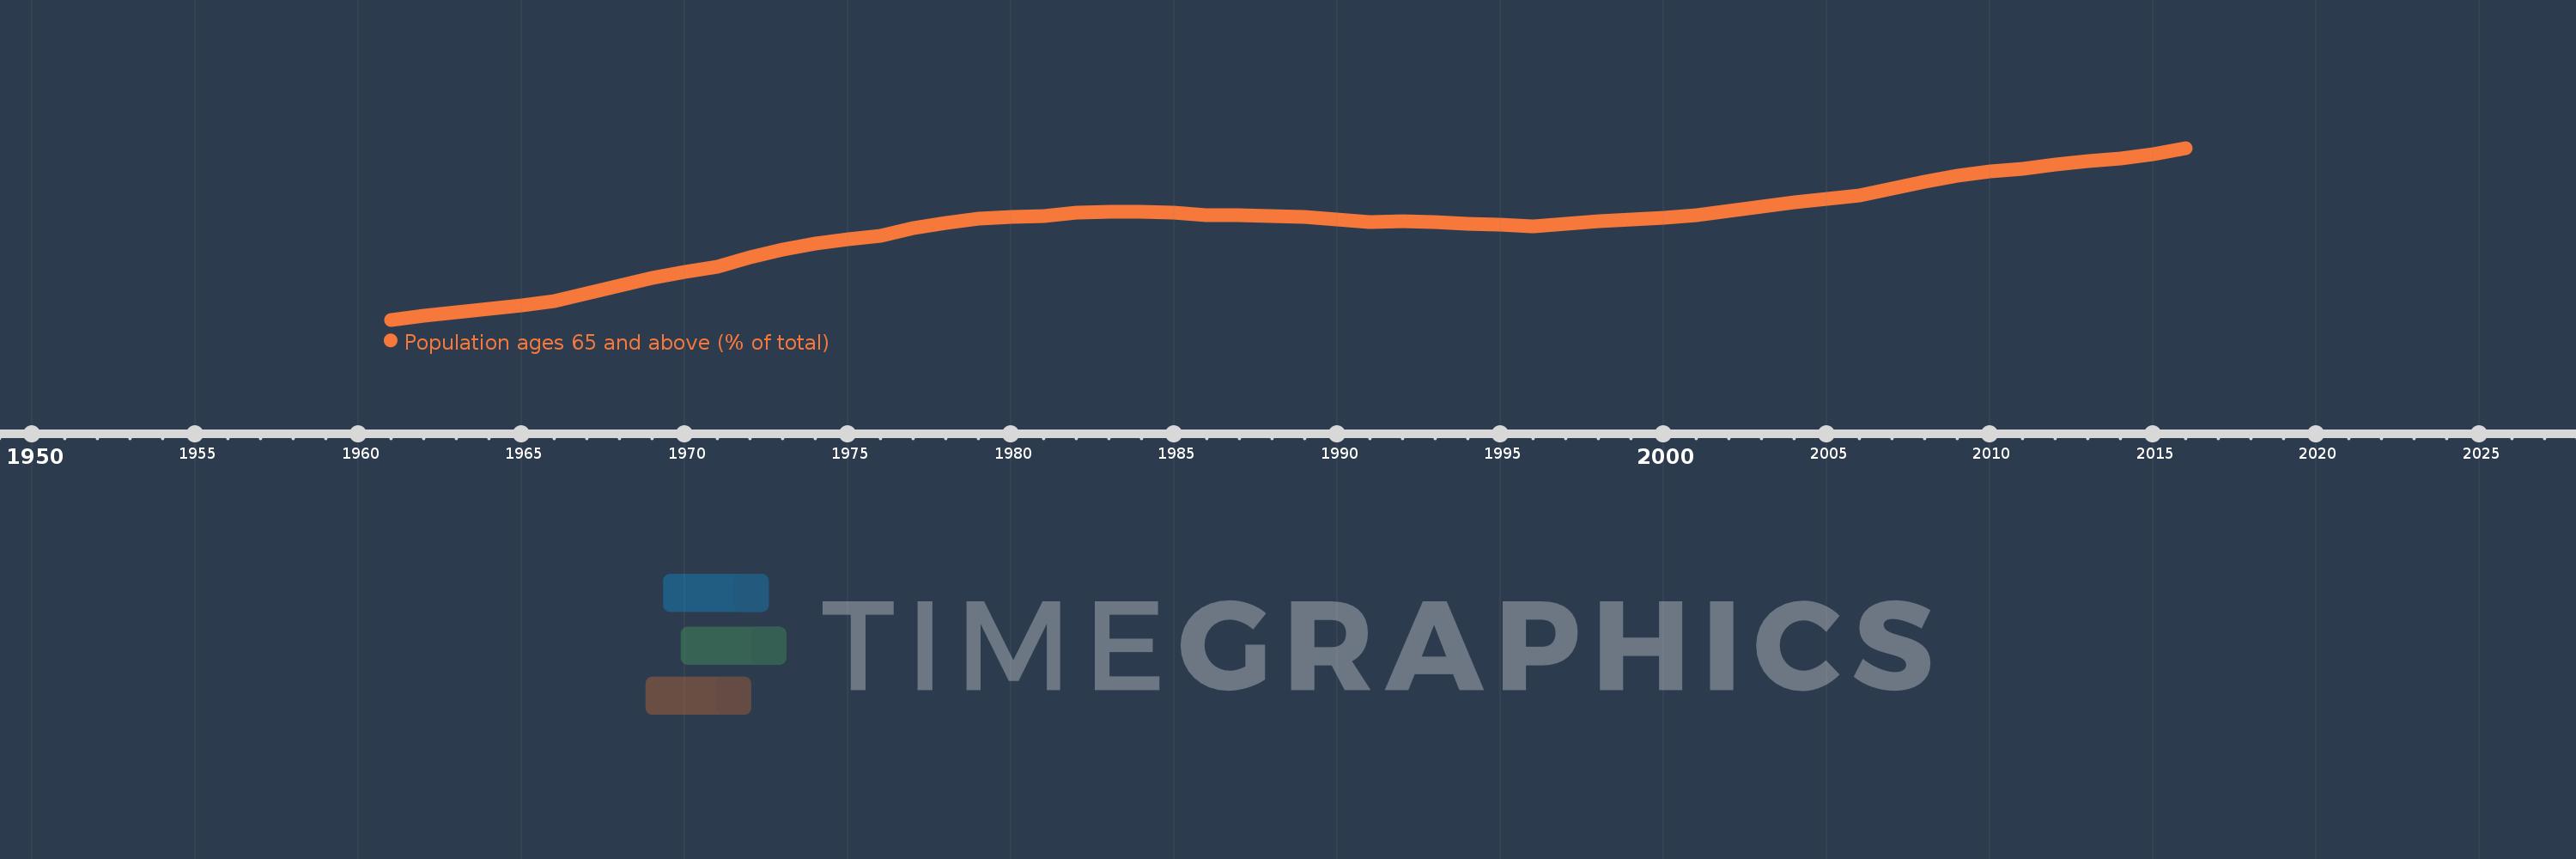
Population ages 65 and above (% of total)
2016,2015,2014,2013,2012,2011,2010,2009,2008,2007,2006,2005,2004,2003,2002,2001,2000,1999,1998,1997,1996,1995,1994,1993,1992,1991,1990,1989,1988,1987,1986,1985,1984,1983,1982,1981,1980,1979,1978,1977,1976,1975,1974,1973,1972,1971,1970,1969,1968,1967,1966,1965,1964,1963,1962,1961
This statistics in other country:
AfghanistanAlbaniaAlgeriaAngolaAntigua and BarbudaArab WorldArgentinaArmeniaArubaAustraliaAustriaAzerbaijanBahamas, TheBahrainBangladeshBarbadosBelarusBelgiumBelizeBeninBhutanBoliviaBosnia and HerzegovinaBotswanaBrazilBrunei DarussalamBulgariaBurkina FasoBurundiCabo VerdeCambodiaCameroonCanadaCaribbean small statesCentral African RepublicCentral Europe and the BalticsChadChannel IslandsChileChinaColombiaComorosCongo, Dem. Rep.Congo, Rep.Costa RicaCote d'IvoireCroatiaCubaCuracaoCyprusCzech RepublicDenmarkDjiboutiDominican RepublicEarly-demographic dividendEast Asia & PacificEast Asia & Pacific (excluding high income)East Asia & Pacific (IDA & IBRD countries)EcuadorEgypt, Arab Rep.El SalvadorEquatorial GuineaEritreaEstoniaEthiopiaEuro areaEurope & Central AsiaEurope & Central Asia (excluding high income)Europe & Central Asia (IDA & IBRD countries)European UnionFijiFinlandFragile and conflict affected situationsFranceFrench PolynesiaGabonGambia, TheGeorgiaGermanyGhanaGreeceGrenadaGuamGuatemalaGuineaGuinea-BissauGuyanaHaitiHeavily indebted poor countries (HIPC)High incomeHondurasHong Kong SAR, ChinaHungaryIBRD onlyIcelandIDA & IBRD totalIDA blendIDA onlyIDA totalIndiaIndonesiaIran, Islamic Rep.IraqIrelandIsraelItalyJamaicaJapanJordanKazakhstanKenyaKiribatiKorea, Dem. People’s Rep.Korea, Rep.KosovoKuwaitKyrgyz RepublicLao PDRLate-demographic dividendLatin America & Caribbean Latin America & Caribbean (excluding high income)Latin America & the Caribbean (IDA & IBRD countries)LatviaLeast developed countries: UN classificationLebanonLesothoLiberiaLibyaLithuaniaLow & middle incomeLow incomeLower middle incomeLuxembourgMacao SAR, ChinaMacedonia, FYRMadagascarMalawiMalaysiaMaldivesMaliMaltaMauritaniaMauritiusMexicoMicronesia, Fed. Sts.Middle East & North AfricaMiddle East & North Africa (excluding high income)Middle East & North Africa (IDA & IBRD countries)Middle incomeMoldovaMongoliaMontenegroMoroccoMozambiqueMyanmarNamibiaNepalNetherlandsNew CaledoniaNew ZealandNicaraguaNigerNigeriaNorth AmericaNorwayOECD membersOmanOther small statesPacific island small statesPakistanPanamaPapua New GuineaParaguayPeruPhilippinesPolandPortugalPost-demographic dividendPre-demographic dividendPuerto RicoQatarRomaniaRussian FederationRwandaSamoaSao Tome and PrincipeSaudi ArabiaSenegalSerbiaSeychellesSierra LeoneSingaporeSlovak RepublicSloveniaSmall statesSolomon IslandsSomaliaSouth AfricaSouth AsiaSouth Asia (IDA & IBRD)South SudanSpainSri LankaSt. LuciaSt. Vincent and the GrenadinesSub-Saharan Africa Sub-Saharan Africa (excluding high income)Sub-Saharan Africa (IDA & IBRD countries)SudanSurinameSwazilandSwedenSwitzerlandSyrian Arab RepublicTajikistanTanzaniaThailandTimor-LesteTogoTongaTrinidad and TobagoTunisiaTurkeyTurkmenistanUgandaUkraineUnited Arab EmiratesUnited KingdomUnited StatesUpper middle incomeUruguayUzbekistanVanuatuVenezuela, RBVietnamVirgin Islands (U.S.)West Bank and GazaWorldYemen, Rep.ZambiaZimbabwe Timeline:
This timeline shows a graph from 1961 to 2016 of Haiti. No data until 1960. Number of actual observations by date: 56.
Source name:
World Development Indicators
Source organization:
World Bank staff estimates based on age distributions of United Nations Population Division's World Population Prospects.
Categories, topics:
Health
Last updated:
apr 23, 2017
Indicators value changes by year
At the date of observation
Value
Absolute change
Change from previous value
jan 1, 1961
3.223
+3.223
0.0%
jan 1, 1962
3.256
+0.033
1.02%
jan 1, 1963
3.285
+0.029
0.91%
jan 1, 1964
3.312
+0.028
0.84%
jan 1, 1965
3.341
+0.029
0.87%
jan 1, 1966
3.373
+0.031
0.94%
jan 1, 1967
3.439
+0.066
1.95%
jan 1, 1968
3.503
+0.064
1.87%
jan 1, 1969
3.563
+0.06
1.72%
jan 1, 1970
3.615
+0.053
1.47%
jan 1, 1971
3.659
+0.044
1.21%
jan 1, 1972
3.733
+0.073
2.0%
jan 1, 1973
3.795
+0.062
1.66%
jan 1, 1974
3.845
+0.051
1.34%
jan 1, 1975
3.885
+0.039
1.02%
jan 1, 1976
3.912
+0.027
0.7%
jan 1, 1977
3.974
+0.062
1.58%
jan 1, 1978
4.019
+0.045
1.14%
jan 1, 1979
4.05
+0.031
0.77%
jan 1, 1980
4.068
+0.018
0.44%
jan 1, 1981
4.074
+0.006
0.14%
jan 1, 1982
4.098
+0.025
0.6%
jan 1, 1983
4.11
+0.011
0.28%
jan 1, 1984
4.109
-0.001
-0.02%
jan 1, 1985
4.098
-0.011
-0.26%
jan 1, 1986
4.08
-0.018
-0.44%
jan 1, 1987
4.078
-0.002
-0.05%
jan 1, 1988
4.073
-0.005
-0.12%
jan 1, 1989
4.063
-0.01
-0.24%
jan 1, 1990
4.046
-0.017
-0.43%
jan 1, 1991
4.021
-0.025
-0.63%
jan 1, 1992
4.028
+0.008
0.19%
jan 1, 1993
4.023
-0.005
-0.12%
jan 1, 1994
4.011
-0.012
-0.3%
jan 1, 1995
3.999
-0.012
-0.31%
jan 1, 1996
3.989
-0.009
-0.24%
jan 1, 1997
4.009
+0.02
0.5%
jan 1, 1998
4.027
+0.018
0.45%
jan 1, 1999
4.044
+0.017
0.42%
jan 1, 2000
4.061
+0.016
0.4%
jan 1, 2001
4.077
+0.016
0.4%
jan 1, 2002
4.116
+0.039
0.97%
jan 1, 2003
4.152
+0.036
0.87%
jan 1, 2004
4.185
+0.032
0.78%
jan 1, 2005
4.213
+0.029
0.69%
jan 1, 2006
4.239
+0.025
0.6%
jan 1, 2007
4.299
+0.06
1.41%
jan 1, 2008
4.354
+0.056
1.3%
jan 1, 2009
4.402
+0.048
1.1%
jan 1, 2010
4.437
+0.035
0.79%
jan 1, 2011
4.457
+0.02
0.45%
jan 1, 2012
4.496
+0.039
0.86%
jan 1, 2013
4.522
+0.026
0.58%
jan 1, 2014
4.545
+0.024
0.52%
jan 1, 2015
4.579
+0.034
0.75%
jan 1, 2016
4.631
+0.051
1.12%
Ranking of countries by current statistics by years


Comments: