29
/
en
AIzaSyAYiBZKx7MnpbEhh9jyipgxe19OcubqV5w
April 1, 2024
276065
United Kingdom
GBR
true
2
1
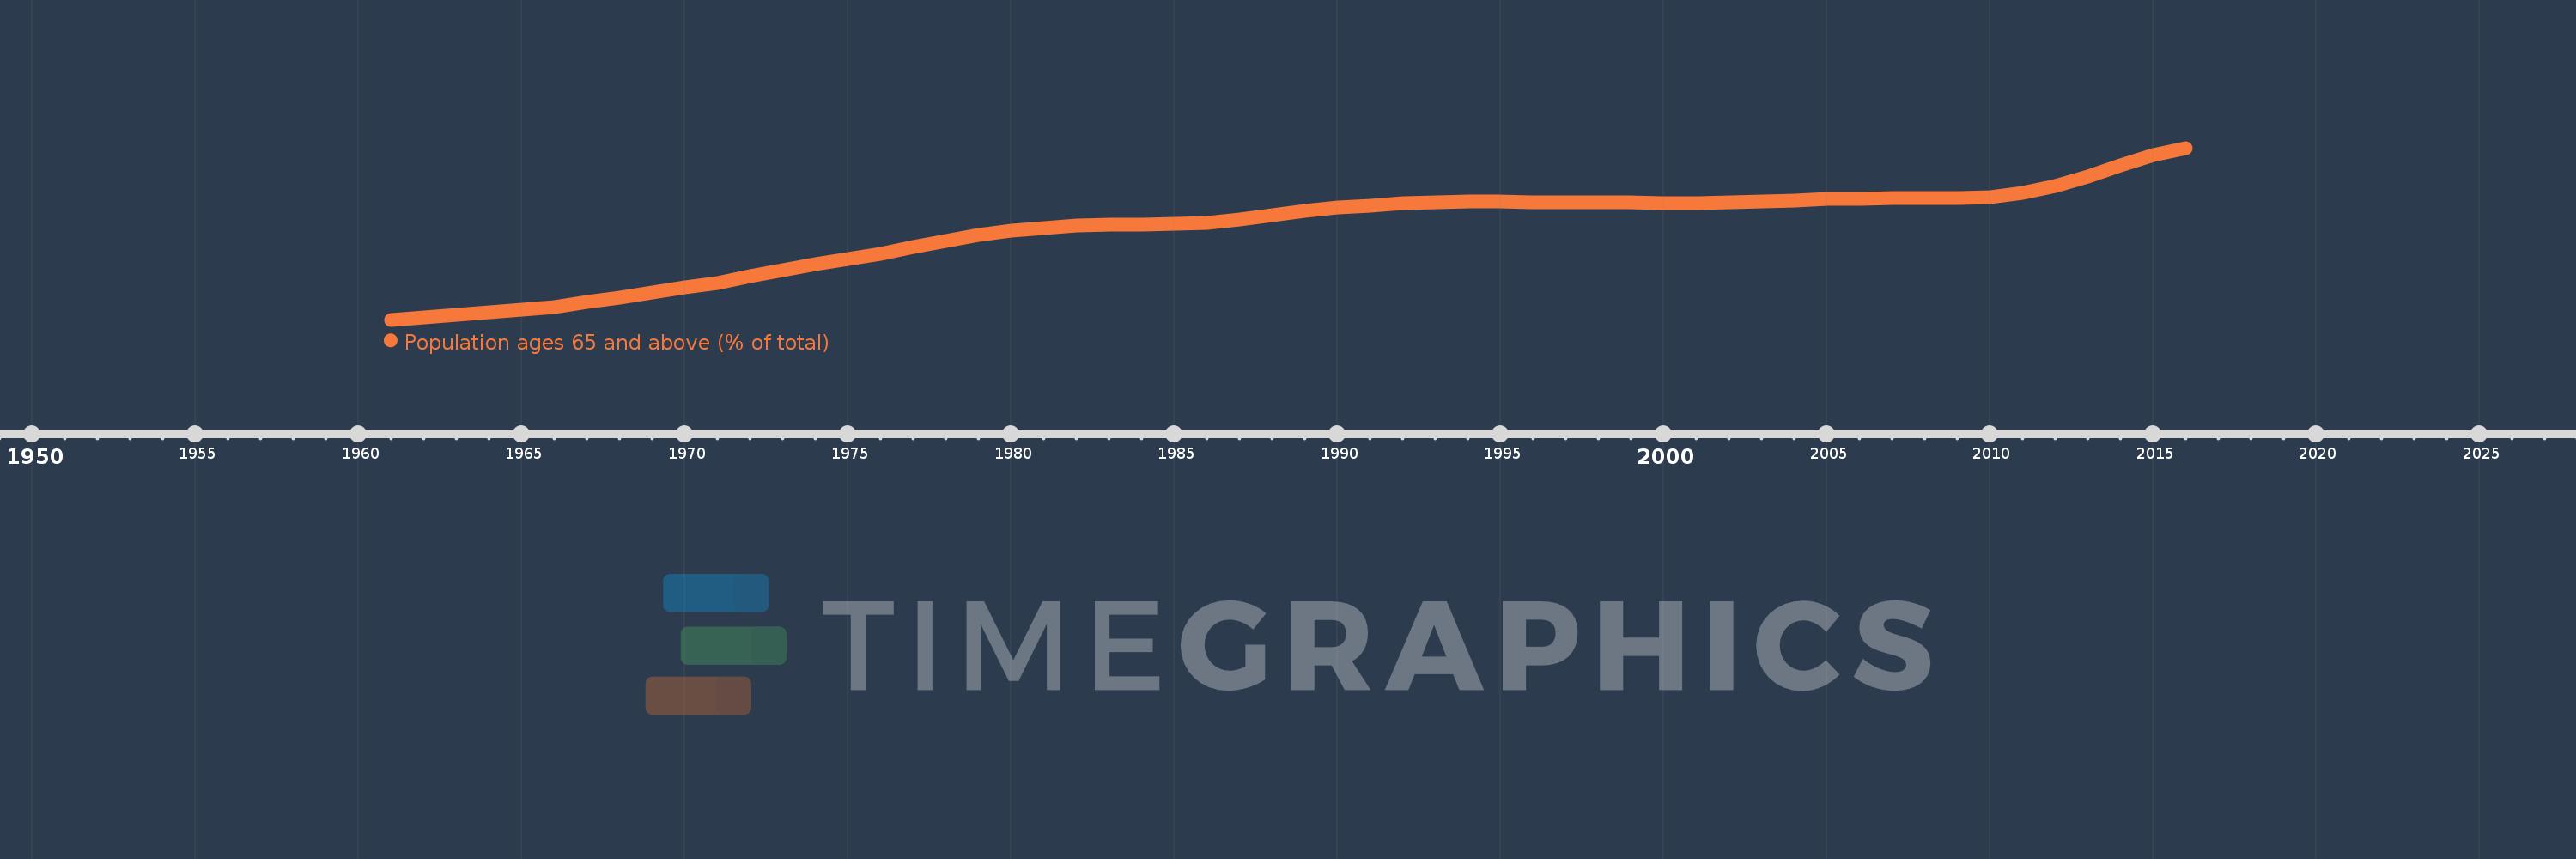
Population ages 65 and above (% of total)
2016,2015,2014,2013,2012,2011,2010,2009,2008,2007,2006,2005,2004,2003,2002,2001,2000,1999,1998,1997,1996,1995,1994,1993,1992,1991,1990,1989,1988,1987,1986,1985,1984,1983,1982,1981,1980,1979,1978,1977,1976,1975,1974,1973,1972,1971,1970,1969,1968,1967,1966,1965,1964,1963,1962,1961
This statistics in other country:
AfghanistanAlbaniaAlgeriaAngolaAntigua and BarbudaArab WorldArgentinaArmeniaArubaAustraliaAustriaAzerbaijanBahamas, TheBahrainBangladeshBarbadosBelarusBelgiumBelizeBeninBhutanBoliviaBosnia and HerzegovinaBotswanaBrazilBrunei DarussalamBulgariaBurkina FasoBurundiCabo VerdeCambodiaCameroonCanadaCaribbean small statesCentral African RepublicCentral Europe and the BalticsChadChannel IslandsChileChinaColombiaComorosCongo, Dem. Rep.Congo, Rep.Costa RicaCote d'IvoireCroatiaCubaCuracaoCyprusCzech RepublicDenmarkDjiboutiDominican RepublicEarly-demographic dividendEast Asia & PacificEast Asia & Pacific (excluding high income)East Asia & Pacific (IDA & IBRD countries)EcuadorEgypt, Arab Rep.El SalvadorEquatorial GuineaEritreaEstoniaEthiopiaEuro areaEurope & Central AsiaEurope & Central Asia (excluding high income)Europe & Central Asia (IDA & IBRD countries)European UnionFijiFinlandFragile and conflict affected situationsFranceFrench PolynesiaGabonGambia, TheGeorgiaGermanyGhanaGreeceGrenadaGuamGuatemalaGuineaGuinea-BissauGuyanaHaitiHeavily indebted poor countries (HIPC)High incomeHondurasHong Kong SAR, ChinaHungaryIBRD onlyIcelandIDA & IBRD totalIDA blendIDA onlyIDA totalIndiaIndonesiaIran, Islamic Rep.IraqIrelandIsraelItalyJamaicaJapanJordanKazakhstanKenyaKiribatiKorea, Dem. People’s Rep.Korea, Rep.KosovoKuwaitKyrgyz RepublicLao PDRLate-demographic dividendLatin America & Caribbean Latin America & Caribbean (excluding high income)Latin America & the Caribbean (IDA & IBRD countries)LatviaLeast developed countries: UN classificationLebanonLesothoLiberiaLibyaLithuaniaLow & middle incomeLow incomeLower middle incomeLuxembourgMacao SAR, ChinaMacedonia, FYRMadagascarMalawiMalaysiaMaldivesMaliMaltaMauritaniaMauritiusMexicoMicronesia, Fed. Sts.Middle East & North AfricaMiddle East & North Africa (excluding high income)Middle East & North Africa (IDA & IBRD countries)Middle incomeMoldovaMongoliaMontenegroMoroccoMozambiqueMyanmarNamibiaNepalNetherlandsNew CaledoniaNew ZealandNicaraguaNigerNigeriaNorth AmericaNorwayOECD membersOmanOther small statesPacific island small statesPakistanPanamaPapua New GuineaParaguayPeruPhilippinesPolandPortugalPost-demographic dividendPre-demographic dividendPuerto RicoQatarRomaniaRussian FederationRwandaSamoaSao Tome and PrincipeSaudi ArabiaSenegalSerbiaSeychellesSierra LeoneSingaporeSlovak RepublicSloveniaSmall statesSolomon IslandsSomaliaSouth AfricaSouth AsiaSouth Asia (IDA & IBRD)South SudanSpainSri LankaSt. LuciaSt. Vincent and the GrenadinesSub-Saharan Africa Sub-Saharan Africa (excluding high income)Sub-Saharan Africa (IDA & IBRD countries)SudanSurinameSwazilandSwedenSwitzerlandSyrian Arab RepublicTajikistanTanzaniaThailandTimor-LesteTogoTongaTrinidad and TobagoTunisiaTurkeyTurkmenistanUgandaUkraineUnited Arab EmiratesUnited KingdomUnited StatesUpper middle incomeUruguayUzbekistanVanuatuVenezuela, RBVietnamVirgin Islands (U.S.)West Bank and GazaWorldYemen, Rep.ZambiaZimbabwe Timeline:
This timeline shows a graph from 1961 to 2016 of United Kingdom. No data until 1960. Number of actual observations by date: 56.
Source name:
World Development Indicators
Source organization:
World Bank staff estimates based on age distributions of United Nations Population Division's World Population Prospects.
Categories, topics:
Health
Last updated:
apr 23, 2017
Indicators value changes by year
Minimum:
11.754
jan 1, 1961
At the date of observation
Value
Absolute change
Change from previous value
jan 1, 1961
11.754
+11.754
0.0%
jan 1, 1962
11.849
+0.095
0.81%
jan 1, 1963
11.935
+0.087
0.73%
jan 1, 1964
12.019
+0.084
0.7%
jan 1, 1965
12.103
+0.084
0.7%
jan 1, 1966
12.194
+0.091
0.75%
jan 1, 1967
12.361
+0.167
1.37%
jan 1, 1968
12.536
+0.175
1.41%
jan 1, 1969
12.71
+0.174
1.39%
jan 1, 1970
12.877
+0.167
1.31%
jan 1, 1971
13.036
+0.159
1.24%
jan 1, 1972
13.272
+0.236
1.81%
jan 1, 1973
13.487
+0.216
1.63%
jan 1, 1974
13.688
+0.2
1.48%
jan 1, 1975
13.877
+0.189
1.38%
jan 1, 1976
14.057
+0.18
1.3%
jan 1, 1977
14.297
+0.241
1.71%
jan 1, 1978
14.52
+0.223
1.56%
jan 1, 1979
14.715
+0.195
1.34%
jan 1, 1980
14.861
+0.147
1.0%
jan 1, 1981
14.949
+0.088
0.59%
jan 1, 1982
15.054
+0.105
0.71%
jan 1, 1983
15.092
+0.037
0.25%
jan 1, 1984
15.092
0.0
0.0%
jan 1, 1985
15.1
+0.008
0.05%
jan 1, 1986
15.141
+0.041
0.27%
jan 1, 1987
15.257
+0.116
0.77%
jan 1, 1988
15.403
+0.146
0.96%
jan 1, 1989
15.553
+0.149
0.97%
jan 1, 1990
15.668
+0.115
0.74%
jan 1, 1991
15.732
+0.064
0.41%
jan 1, 1992
15.826
+0.094
0.6%
jan 1, 1993
15.873
+0.047
0.3%
jan 1, 1994
15.884
+0.011
0.07%
jan 1, 1995
15.875
-0.009
-0.06%
jan 1, 1996
15.855
-0.02
-0.13%
jan 1, 1997
15.862
+0.007
0.04%
jan 1, 1998
15.858
-0.004
-0.02%
jan 1, 1999
15.849
-0.009
-0.05%
jan 1, 2000
15.838
-0.011
-0.07%
jan 1, 2001
15.827
-0.011
-0.07%
jan 1, 2002
15.86
+0.033
0.21%
jan 1, 2003
15.895
+0.035
0.22%
jan 1, 2004
15.932
+0.037
0.23%
jan 1, 2005
15.965
+0.034
0.21%
jan 1, 2006
15.994
+0.028
0.18%
jan 1, 2007
16.009
+0.016
0.1%
jan 1, 2008
16.006
-0.003
-0.02%
jan 1, 2009
16.007
+0.001
0.01%
jan 1, 2010
16.054
+0.047
0.29%
jan 1, 2011
16.175
+0.121
0.75%
jan 1, 2012
16.432
+0.257
1.59%
jan 1, 2013
16.774
+0.343
2.09%
jan 1, 2014
17.155
+0.381
2.27%
jan 1, 2015
17.499
+0.343
2.0%
jan 1, 2016
17.76
+0.262
1.5%
Ranking of countries by current statistics by years


Comments: