29
/
en
AIzaSyAYiBZKx7MnpbEhh9jyipgxe19OcubqV5w
April 1, 2024
169451
Korea, Dem. People’s Rep.
PRK
true
2
1
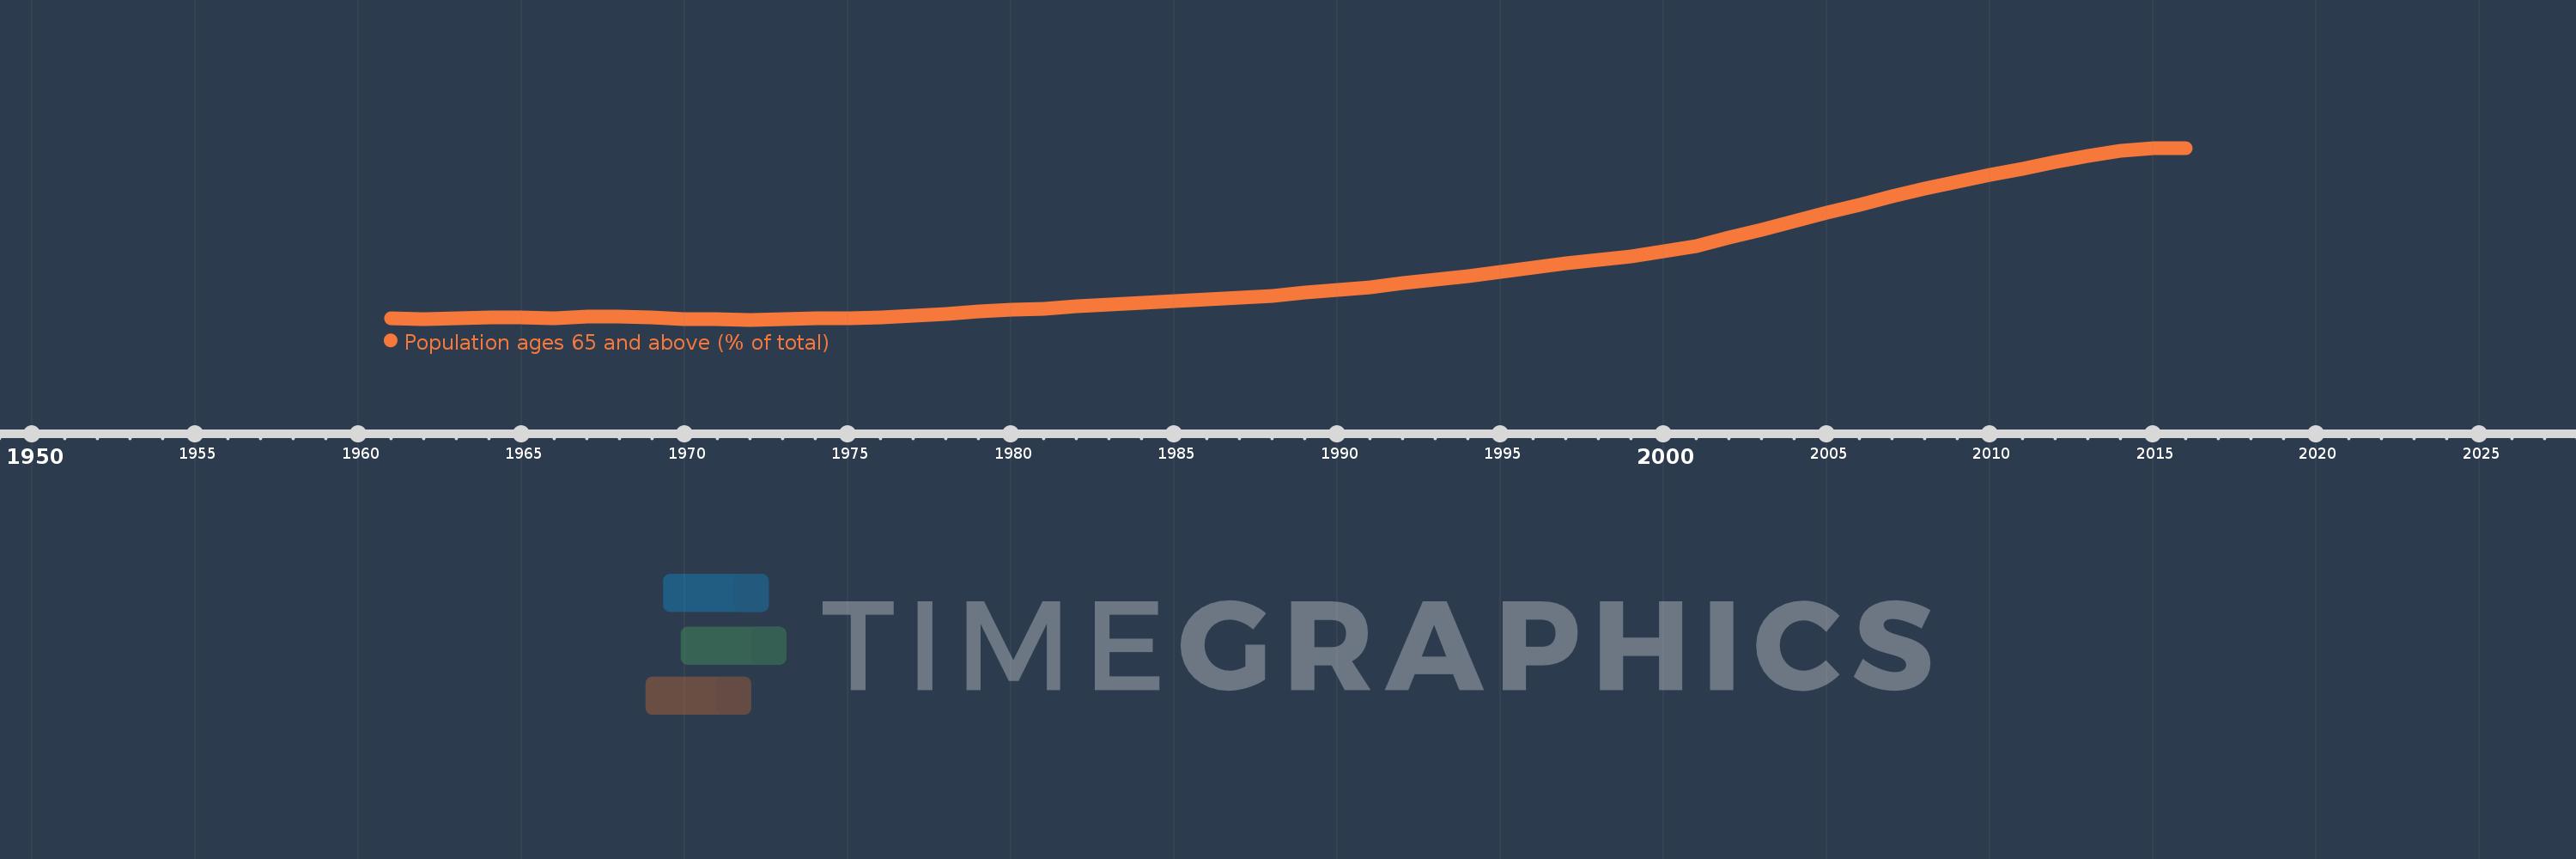
Population ages 65 and above (% of total)
2016,2015,2014,2013,2012,2011,2010,2009,2008,2007,2006,2005,2004,2003,2002,2001,2000,1999,1998,1997,1996,1995,1994,1993,1992,1991,1990,1989,1988,1987,1986,1985,1984,1983,1982,1981,1980,1979,1978,1977,1976,1975,1974,1973,1972,1971,1970,1969,1968,1967,1966,1965,1964,1963,1962,1961
This statistics in other country:
AfghanistanAlbaniaAlgeriaAngolaAntigua and BarbudaArab WorldArgentinaArmeniaArubaAustraliaAustriaAzerbaijanBahamas, TheBahrainBangladeshBarbadosBelarusBelgiumBelizeBeninBhutanBoliviaBosnia and HerzegovinaBotswanaBrazilBrunei DarussalamBulgariaBurkina FasoBurundiCabo VerdeCambodiaCameroonCanadaCaribbean small statesCentral African RepublicCentral Europe and the BalticsChadChannel IslandsChileChinaColombiaComorosCongo, Dem. Rep.Congo, Rep.Costa RicaCote d'IvoireCroatiaCubaCuracaoCyprusCzech RepublicDenmarkDjiboutiDominican RepublicEarly-demographic dividendEast Asia & PacificEast Asia & Pacific (excluding high income)East Asia & Pacific (IDA & IBRD countries)EcuadorEgypt, Arab Rep.El SalvadorEquatorial GuineaEritreaEstoniaEthiopiaEuro areaEurope & Central AsiaEurope & Central Asia (excluding high income)Europe & Central Asia (IDA & IBRD countries)European UnionFijiFinlandFragile and conflict affected situationsFranceFrench PolynesiaGabonGambia, TheGeorgiaGermanyGhanaGreeceGrenadaGuamGuatemalaGuineaGuinea-BissauGuyanaHaitiHeavily indebted poor countries (HIPC)High incomeHondurasHong Kong SAR, ChinaHungaryIBRD onlyIcelandIDA & IBRD totalIDA blendIDA onlyIDA totalIndiaIndonesiaIran, Islamic Rep.IraqIrelandIsraelItalyJamaicaJapanJordanKazakhstanKenyaKiribatiKorea, Dem. People’s Rep.Korea, Rep.KosovoKuwaitKyrgyz RepublicLao PDRLate-demographic dividendLatin America & Caribbean Latin America & Caribbean (excluding high income)Latin America & the Caribbean (IDA & IBRD countries)LatviaLeast developed countries: UN classificationLebanonLesothoLiberiaLibyaLithuaniaLow & middle incomeLow incomeLower middle incomeLuxembourgMacao SAR, ChinaMacedonia, FYRMadagascarMalawiMalaysiaMaldivesMaliMaltaMauritaniaMauritiusMexicoMicronesia, Fed. Sts.Middle East & North AfricaMiddle East & North Africa (excluding high income)Middle East & North Africa (IDA & IBRD countries)Middle incomeMoldovaMongoliaMontenegroMoroccoMozambiqueMyanmarNamibiaNepalNetherlandsNew CaledoniaNew ZealandNicaraguaNigerNigeriaNorth AmericaNorwayOECD membersOmanOther small statesPacific island small statesPakistanPanamaPapua New GuineaParaguayPeruPhilippinesPolandPortugalPost-demographic dividendPre-demographic dividendPuerto RicoQatarRomaniaRussian FederationRwandaSamoaSao Tome and PrincipeSaudi ArabiaSenegalSerbiaSeychellesSierra LeoneSingaporeSlovak RepublicSloveniaSmall statesSolomon IslandsSomaliaSouth AfricaSouth AsiaSouth Asia (IDA & IBRD)South SudanSpainSri LankaSt. LuciaSt. Vincent and the GrenadinesSub-Saharan Africa Sub-Saharan Africa (excluding high income)Sub-Saharan Africa (IDA & IBRD countries)SudanSurinameSwazilandSwedenSwitzerlandSyrian Arab RepublicTajikistanTanzaniaThailandTimor-LesteTogoTongaTrinidad and TobagoTunisiaTurkeyTurkmenistanUgandaUkraineUnited Arab EmiratesUnited KingdomUnited StatesUpper middle incomeUruguayUzbekistanVanuatuVenezuela, RBVietnamVirgin Islands (U.S.)West Bank and GazaWorldYemen, Rep.ZambiaZimbabwe Timeline:
This timeline shows a graph from 1961 to 2016 of Korea, Dem. People’s Rep.. No data until 1960. Number of actual observations by date: 56.
Source name:
World Development Indicators
Source organization:
World Bank staff estimates based on age distributions of United Nations Population Division's World Population Prospects.
Categories, topics:
Health
Last updated:
apr 23, 2017
Indicators value changes by year
At the date of observation
Value
Absolute change
Change from previous value
jan 1, 1961
3.208
+3.208
0.0%
jan 1, 1962
3.186
-0.023
-0.71%
jan 1, 1963
3.206
+0.02
0.62%
jan 1, 1964
3.239
+0.034
1.05%
jan 1, 1965
3.245
+0.006
0.18%
jan 1, 1966
3.206
-0.039
-1.21%
jan 1, 1967
3.273
+0.067
2.08%
jan 1, 1968
3.274
+0.002
0.05%
jan 1, 1969
3.236
-0.038
-1.17%
jan 1, 1970
3.197
-0.039
-1.22%
jan 1, 1971
3.172
-0.025
-0.78%
jan 1, 1972
3.164
-0.007
-0.24%
jan 1, 1973
3.178
+0.014
0.43%
jan 1, 1974
3.204
+0.026
0.81%
jan 1, 1975
3.227
+0.024
0.74%
jan 1, 1976
3.246
+0.019
0.59%
jan 1, 1977
3.32
+0.074
2.28%
jan 1, 1978
3.394
+0.074
2.23%
jan 1, 1979
3.464
+0.07
2.06%
jan 1, 1980
3.526
+0.062
1.79%
jan 1, 1981
3.578
+0.052
1.48%
jan 1, 1982
3.675
+0.097
2.7%
jan 1, 1983
3.74
+0.065
1.78%
jan 1, 1984
3.789
+0.049
1.31%
jan 1, 1985
3.842
+0.053
1.39%
jan 1, 1986
3.908
+0.067
1.73%
jan 1, 1987
3.973
+0.064
1.64%
jan 1, 1988
4.064
+0.092
2.3%
jan 1, 1989
4.17
+0.106
2.61%
jan 1, 1990
4.271
+0.101
2.42%
jan 1, 1991
4.36
+0.089
2.09%
jan 1, 1992
4.513
+0.153
3.51%
jan 1, 1993
4.654
+0.141
3.13%
jan 1, 1994
4.792
+0.138
2.96%
jan 1, 1995
4.943
+0.151
3.16%
jan 1, 1996
5.118
+0.175
3.53%
jan 1, 1997
5.248
+0.13
2.53%
jan 1, 1998
5.383
+0.136
2.58%
jan 1, 1999
5.534
+0.151
2.8%
jan 1, 2000
5.71
+0.176
3.19%
jan 1, 2001
5.918
+0.208
3.64%
jan 1, 2002
6.212
+0.293
4.96%
jan 1, 2003
6.52
+0.308
4.96%
jan 1, 2004
6.831
+0.312
4.78%
jan 1, 2005
7.138
+0.307
4.49%
jan 1, 2006
7.438
+0.3
4.2%
jan 1, 2007
7.746
+0.308
4.14%
jan 1, 2008
8.036
+0.29
3.74%
jan 1, 2009
8.305
+0.269
3.35%
jan 1, 2010
8.553
+0.248
2.98%
jan 1, 2011
8.778
+0.225
2.63%
jan 1, 2012
9.031
+0.253
2.89%
jan 1, 2013
9.269
+0.238
2.63%
jan 1, 2014
9.459
+0.19
2.05%
jan 1, 2015
9.555
+0.096
1.01%
jan 1, 2016
9.539
-0.015
-0.16%
Ranking of countries by current statistics by years


Comments: