29
/
en
AIzaSyAYiBZKx7MnpbEhh9jyipgxe19OcubqV5w
April 1, 2024
173344
Kyrgyz Republic
KGZ
true
2
1
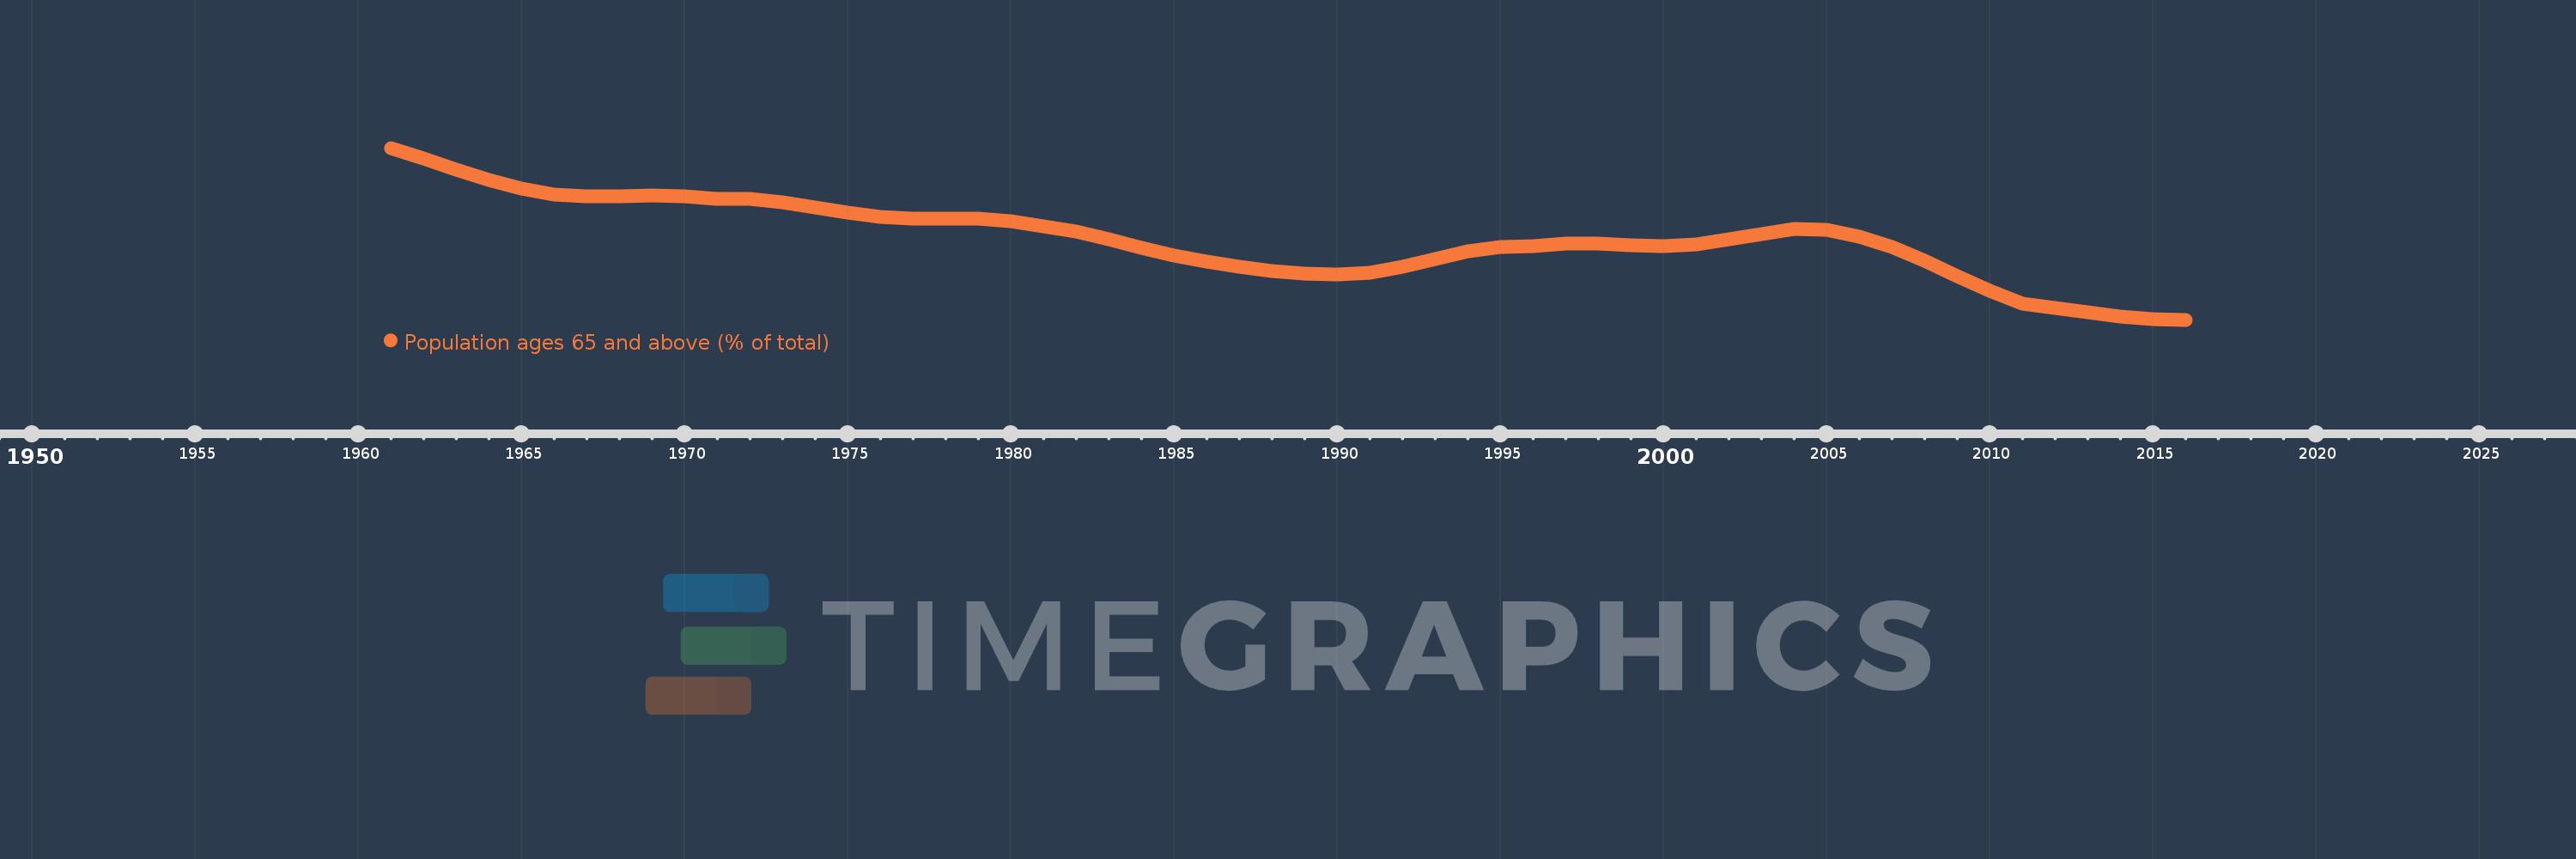
Population ages 65 and above (% of total)
2016,2015,2014,2013,2012,2011,2010,2009,2008,2007,2006,2005,2004,2003,2002,2001,2000,1999,1998,1997,1996,1995,1994,1993,1992,1991,1990,1989,1988,1987,1986,1985,1984,1983,1982,1981,1980,1979,1978,1977,1976,1975,1974,1973,1972,1971,1970,1969,1968,1967,1966,1965,1964,1963,1962,1961
This statistics in other country:
AfghanistanAlbaniaAlgeriaAngolaAntigua and BarbudaArab WorldArgentinaArmeniaArubaAustraliaAustriaAzerbaijanBahamas, TheBahrainBangladeshBarbadosBelarusBelgiumBelizeBeninBhutanBoliviaBosnia and HerzegovinaBotswanaBrazilBrunei DarussalamBulgariaBurkina FasoBurundiCabo VerdeCambodiaCameroonCanadaCaribbean small statesCentral African RepublicCentral Europe and the BalticsChadChannel IslandsChileChinaColombiaComorosCongo, Dem. Rep.Congo, Rep.Costa RicaCote d'IvoireCroatiaCubaCuracaoCyprusCzech RepublicDenmarkDjiboutiDominican RepublicEarly-demographic dividendEast Asia & PacificEast Asia & Pacific (excluding high income)East Asia & Pacific (IDA & IBRD countries)EcuadorEgypt, Arab Rep.El SalvadorEquatorial GuineaEritreaEstoniaEthiopiaEuro areaEurope & Central AsiaEurope & Central Asia (excluding high income)Europe & Central Asia (IDA & IBRD countries)European UnionFijiFinlandFragile and conflict affected situationsFranceFrench PolynesiaGabonGambia, TheGeorgiaGermanyGhanaGreeceGrenadaGuamGuatemalaGuineaGuinea-BissauGuyanaHaitiHeavily indebted poor countries (HIPC)High incomeHondurasHong Kong SAR, ChinaHungaryIBRD onlyIcelandIDA & IBRD totalIDA blendIDA onlyIDA totalIndiaIndonesiaIran, Islamic Rep.IraqIrelandIsraelItalyJamaicaJapanJordanKazakhstanKenyaKiribatiKorea, Dem. People’s Rep.Korea, Rep.KosovoKuwaitKyrgyz RepublicLao PDRLate-demographic dividendLatin America & Caribbean Latin America & Caribbean (excluding high income)Latin America & the Caribbean (IDA & IBRD countries)LatviaLeast developed countries: UN classificationLebanonLesothoLiberiaLibyaLithuaniaLow & middle incomeLow incomeLower middle incomeLuxembourgMacao SAR, ChinaMacedonia, FYRMadagascarMalawiMalaysiaMaldivesMaliMaltaMauritaniaMauritiusMexicoMicronesia, Fed. Sts.Middle East & North AfricaMiddle East & North Africa (excluding high income)Middle East & North Africa (IDA & IBRD countries)Middle incomeMoldovaMongoliaMontenegroMoroccoMozambiqueMyanmarNamibiaNepalNetherlandsNew CaledoniaNew ZealandNicaraguaNigerNigeriaNorth AmericaNorwayOECD membersOmanOther small statesPacific island small statesPakistanPanamaPapua New GuineaParaguayPeruPhilippinesPolandPortugalPost-demographic dividendPre-demographic dividendPuerto RicoQatarRomaniaRussian FederationRwandaSamoaSao Tome and PrincipeSaudi ArabiaSenegalSerbiaSeychellesSierra LeoneSingaporeSlovak RepublicSloveniaSmall statesSolomon IslandsSomaliaSouth AfricaSouth AsiaSouth Asia (IDA & IBRD)South SudanSpainSri LankaSt. LuciaSt. Vincent and the GrenadinesSub-Saharan Africa Sub-Saharan Africa (excluding high income)Sub-Saharan Africa (IDA & IBRD countries)SudanSurinameSwazilandSwedenSwitzerlandSyrian Arab RepublicTajikistanTanzaniaThailandTimor-LesteTogoTongaTrinidad and TobagoTunisiaTurkeyTurkmenistanUgandaUkraineUnited Arab EmiratesUnited KingdomUnited StatesUpper middle incomeUruguayUzbekistanVanuatuVenezuela, RBVietnamVirgin Islands (U.S.)West Bank and GazaWorldYemen, Rep.ZambiaZimbabwe Timeline:
This timeline shows a graph from 1961 to 2016 of Kyrgyz Republic. No data until 1960. Number of actual observations by date: 56.
Source name:
World Development Indicators
Source organization:
World Bank staff estimates based on age distributions of United Nations Population Division's World Population Prospects.
Categories, topics:
Health
Last updated:
apr 23, 2017
Indicators value changes by year
At the date of observation
Value
Absolute change
Change from previous value
jan 1, 1961
7.074
+7.074
0.0%
jan 1, 1962
6.895
-0.179
-2.53%
jan 1, 1963
6.713
-0.182
-2.65%
jan 1, 1964
6.542
-0.17
-2.54%
jan 1, 1965
6.403
-0.139
-2.13%
jan 1, 1966
6.303
-0.1
-1.56%
jan 1, 1967
6.271
-0.032
-0.51%
jan 1, 1968
6.271
+0.0
0.0%
jan 1, 1969
6.283
+0.011
0.18%
jan 1, 1970
6.274
-0.009
-0.14%
jan 1, 1971
6.23
-0.044
-0.7%
jan 1, 1972
6.236
+0.006
0.09%
jan 1, 1973
6.179
-0.057
-0.91%
jan 1, 1974
6.09
-0.089
-1.45%
jan 1, 1975
6.003
-0.087
-1.42%
jan 1, 1976
5.933
-0.07
-1.17%
jan 1, 1977
5.908
-0.025
-0.42%
jan 1, 1978
5.906
-0.002
-0.04%
jan 1, 1979
5.903
-0.003
-0.05%
jan 1, 1980
5.863
-0.04
-0.68%
jan 1, 1981
5.771
-0.092
-1.57%
jan 1, 1982
5.685
-0.086
-1.48%
jan 1, 1983
5.558
-0.127
-2.23%
jan 1, 1984
5.415
-0.143
-2.57%
jan 1, 1985
5.289
-0.126
-2.33%
jan 1, 1986
5.195
-0.094
-1.78%
jan 1, 1987
5.108
-0.087
-1.67%
jan 1, 1988
5.036
-0.073
-1.42%
jan 1, 1989
4.985
-0.05
-1.0%
jan 1, 1990
4.972
-0.013
-0.26%
jan 1, 1991
5.005
+0.032
0.65%
jan 1, 1992
5.103
+0.098
1.96%
jan 1, 1993
5.231
+0.128
2.51%
jan 1, 1994
5.357
+0.126
2.41%
jan 1, 1995
5.437
+0.08
1.5%
jan 1, 1996
5.447
+0.01
0.18%
jan 1, 1997
5.496
+0.049
0.89%
jan 1, 1998
5.489
-0.007
-0.13%
jan 1, 1999
5.457
-0.033
-0.59%
jan 1, 2000
5.442
-0.014
-0.26%
jan 1, 2001
5.469
+0.026
0.49%
jan 1, 2002
5.554
+0.085
1.56%
jan 1, 2003
5.653
+0.099
1.79%
jan 1, 2004
5.726
+0.073
1.29%
jan 1, 2005
5.717
-0.009
-0.16%
jan 1, 2006
5.599
-0.118
-2.06%
jan 1, 2007
5.433
-0.166
-2.97%
jan 1, 2008
5.204
-0.229
-4.21%
jan 1, 2009
4.949
-0.256
-4.91%
jan 1, 2010
4.705
-0.243
-4.91%
jan 1, 2011
4.49
-0.216
-4.58%
jan 1, 2012
4.421
-0.069
-1.53%
jan 1, 2013
4.35
-0.072
-1.62%
jan 1, 2014
4.28
-0.07
-1.6%
jan 1, 2015
4.232
-0.048
-1.12%
jan 1, 2016
4.227
-0.005
-0.12%
Ranking of countries by current statistics by years


Comments: