29
/
en
AIzaSyAYiBZKx7MnpbEhh9jyipgxe19OcubqV5w
April 1, 2024
77521
Bahrain
BHR
true
2
1
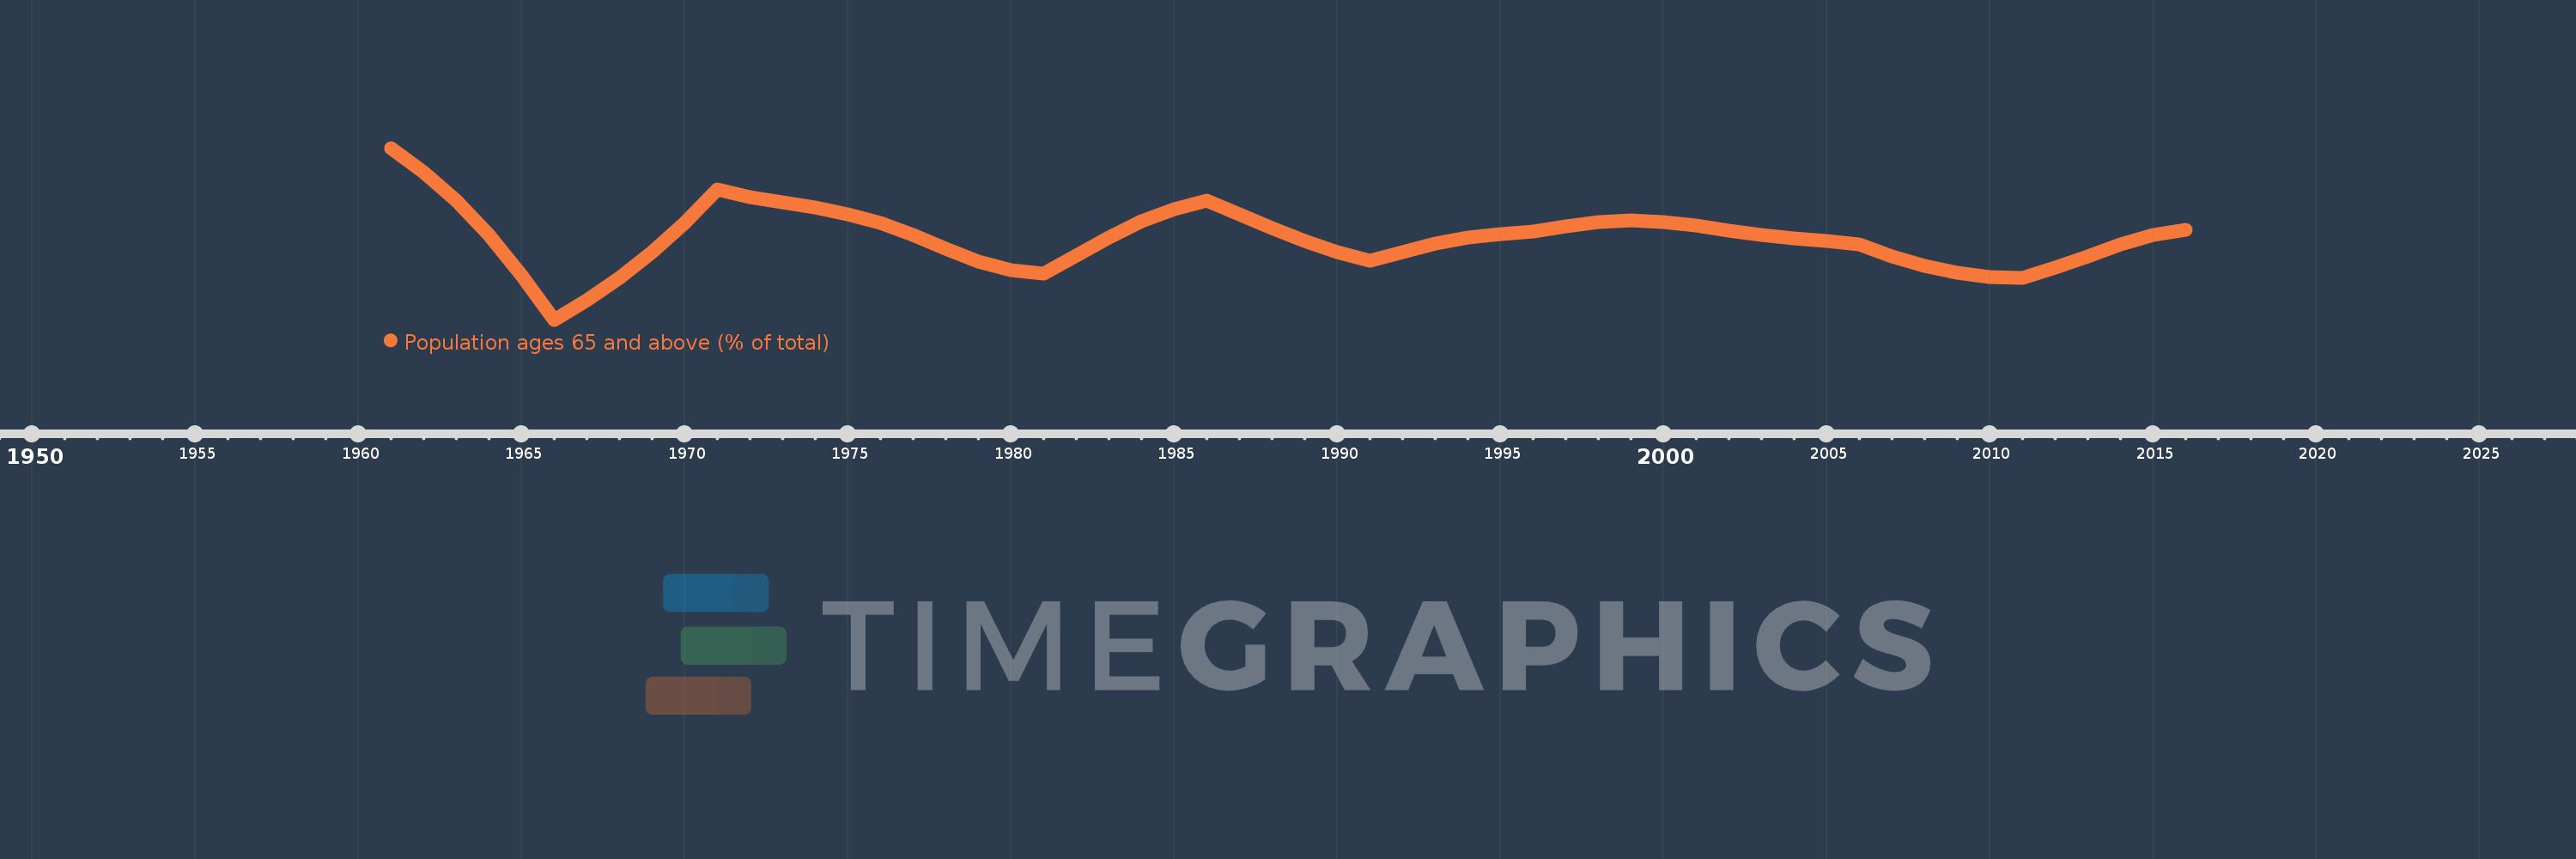
Population ages 65 and above (% of total)
2016,2015,2014,2013,2012,2011,2010,2009,2008,2007,2006,2005,2004,2003,2002,2001,2000,1999,1998,1997,1996,1995,1994,1993,1992,1991,1990,1989,1988,1987,1986,1985,1984,1983,1982,1981,1980,1979,1978,1977,1976,1975,1974,1973,1972,1971,1970,1969,1968,1967,1966,1965,1964,1963,1962,1961
This statistics in other country:
AfghanistanAlbaniaAlgeriaAngolaAntigua and BarbudaArab WorldArgentinaArmeniaArubaAustraliaAustriaAzerbaijanBahamas, TheBahrainBangladeshBarbadosBelarusBelgiumBelizeBeninBhutanBoliviaBosnia and HerzegovinaBotswanaBrazilBrunei DarussalamBulgariaBurkina FasoBurundiCabo VerdeCambodiaCameroonCanadaCaribbean small statesCentral African RepublicCentral Europe and the BalticsChadChannel IslandsChileChinaColombiaComorosCongo, Dem. Rep.Congo, Rep.Costa RicaCote d'IvoireCroatiaCubaCuracaoCyprusCzech RepublicDenmarkDjiboutiDominican RepublicEarly-demographic dividendEast Asia & PacificEast Asia & Pacific (excluding high income)East Asia & Pacific (IDA & IBRD countries)EcuadorEgypt, Arab Rep.El SalvadorEquatorial GuineaEritreaEstoniaEthiopiaEuro areaEurope & Central AsiaEurope & Central Asia (excluding high income)Europe & Central Asia (IDA & IBRD countries)European UnionFijiFinlandFragile and conflict affected situationsFranceFrench PolynesiaGabonGambia, TheGeorgiaGermanyGhanaGreeceGrenadaGuamGuatemalaGuineaGuinea-BissauGuyanaHaitiHeavily indebted poor countries (HIPC)High incomeHondurasHong Kong SAR, ChinaHungaryIBRD onlyIcelandIDA & IBRD totalIDA blendIDA onlyIDA totalIndiaIndonesiaIran, Islamic Rep.IraqIrelandIsraelItalyJamaicaJapanJordanKazakhstanKenyaKiribatiKorea, Dem. People’s Rep.Korea, Rep.KosovoKuwaitKyrgyz RepublicLao PDRLate-demographic dividendLatin America & Caribbean Latin America & Caribbean (excluding high income)Latin America & the Caribbean (IDA & IBRD countries)LatviaLeast developed countries: UN classificationLebanonLesothoLiberiaLibyaLithuaniaLow & middle incomeLow incomeLower middle incomeLuxembourgMacao SAR, ChinaMacedonia, FYRMadagascarMalawiMalaysiaMaldivesMaliMaltaMauritaniaMauritiusMexicoMicronesia, Fed. Sts.Middle East & North AfricaMiddle East & North Africa (excluding high income)Middle East & North Africa (IDA & IBRD countries)Middle incomeMoldovaMongoliaMontenegroMoroccoMozambiqueMyanmarNamibiaNepalNetherlandsNew CaledoniaNew ZealandNicaraguaNigerNigeriaNorth AmericaNorwayOECD membersOmanOther small statesPacific island small statesPakistanPanamaPapua New GuineaParaguayPeruPhilippinesPolandPortugalPost-demographic dividendPre-demographic dividendPuerto RicoQatarRomaniaRussian FederationRwandaSamoaSao Tome and PrincipeSaudi ArabiaSenegalSerbiaSeychellesSierra LeoneSingaporeSlovak RepublicSloveniaSmall statesSolomon IslandsSomaliaSouth AfricaSouth AsiaSouth Asia (IDA & IBRD)South SudanSpainSri LankaSt. LuciaSt. Vincent and the GrenadinesSub-Saharan Africa Sub-Saharan Africa (excluding high income)Sub-Saharan Africa (IDA & IBRD countries)SudanSurinameSwazilandSwedenSwitzerlandSyrian Arab RepublicTajikistanTanzaniaThailandTimor-LesteTogoTongaTrinidad and TobagoTunisiaTurkeyTurkmenistanUgandaUkraineUnited Arab EmiratesUnited KingdomUnited StatesUpper middle incomeUruguayUzbekistanVanuatuVenezuela, RBVietnamVirgin Islands (U.S.)West Bank and GazaWorldYemen, Rep.ZambiaZimbabwe Timeline:
This timeline shows a graph from 1961 to 2016 of Bahrain. No data until 1960. Number of actual observations by date: 56.
Source name:
World Development Indicators
Source organization:
World Bank staff estimates based on age distributions of United Nations Population Division's World Population Prospects.
Categories, topics:
Health
Last updated:
apr 23, 2017
Indicators value changes by year
At the date of observation
Value
Absolute change
Change from previous value
jan 1, 1961
3.033
+3.033
0.0%
jan 1, 1962
2.851
-0.181
-5.98%
jan 1, 1963
2.631
-0.221
-7.73%
jan 1, 1964
2.369
-0.262
-9.95%
jan 1, 1965
2.067
-0.302
-12.75%
jan 1, 1966
1.726
-0.341
-16.49%
jan 1, 1967
1.875
+0.149
8.62%
jan 1, 1968
2.046
+0.171
9.11%
jan 1, 1969
2.239
+0.193
9.46%
jan 1, 1970
2.462
+0.223
9.94%
jan 1, 1971
2.717
+0.255
10.34%
jan 1, 1972
2.66
-0.057
-2.09%
jan 1, 1973
2.62
-0.04
-1.5%
jan 1, 1974
2.582
-0.038
-1.45%
jan 1, 1975
2.531
-0.051
-1.98%
jan 1, 1976
2.462
-0.068
-2.7%
jan 1, 1977
2.369
-0.094
-3.8%
jan 1, 1978
2.265
-0.104
-4.39%
jan 1, 1979
2.17
-0.095
-4.21%
jan 1, 1980
2.104
-0.066
-3.03%
jan 1, 1981
2.074
-0.03
-1.4%
jan 1, 1982
2.214
+0.14
6.73%
jan 1, 1983
2.35
+0.136
6.16%
jan 1, 1984
2.473
+0.122
5.21%
jan 1, 1985
2.57
+0.097
3.93%
jan 1, 1986
2.633
+0.063
2.46%
jan 1, 1987
2.529
-0.104
-3.94%
jan 1, 1988
2.425
-0.105
-4.13%
jan 1, 1989
2.325
-0.1
-4.11%
jan 1, 1990
2.24
-0.085
-3.66%
jan 1, 1991
2.176
-0.063
-2.83%
jan 1, 1992
2.243
+0.067
3.08%
jan 1, 1993
2.305
+0.061
2.72%
jan 1, 1994
2.352
+0.047
2.04%
jan 1, 1995
2.38
+0.028
1.21%
jan 1, 1996
2.397
+0.016
0.69%
jan 1, 1997
2.437
+0.041
1.7%
jan 1, 1998
2.471
+0.034
1.38%
jan 1, 1999
2.482
+0.011
0.44%
jan 1, 2000
2.468
-0.014
-0.55%
jan 1, 2001
2.442
-0.026
-1.05%
jan 1, 2002
2.403
-0.04
-1.63%
jan 1, 2003
2.371
-0.031
-1.3%
jan 1, 2004
2.347
-0.024
-1.01%
jan 1, 2005
2.323
-0.024
-1.02%
jan 1, 2006
2.297
-0.027
-1.16%
jan 1, 2007
2.209
-0.087
-3.8%
jan 1, 2008
2.138
-0.071
-3.21%
jan 1, 2009
2.085
-0.053
-2.48%
jan 1, 2010
2.053
-0.032
-1.55%
jan 1, 2011
2.046
-0.007
-0.36%
jan 1, 2012
2.124
+0.079
3.85%
jan 1, 2013
2.209
+0.085
4.0%
jan 1, 2014
2.297
+0.088
3.96%
jan 1, 2015
2.371
+0.074
3.21%
jan 1, 2016
2.411
+0.04
1.7%
Ranking of countries by current statistics by years


Comments: