29
/
en
AIzaSyAYiBZKx7MnpbEhh9jyipgxe19OcubqV5w
April 1, 2024
175747
Latvia
LVA
true
2
1
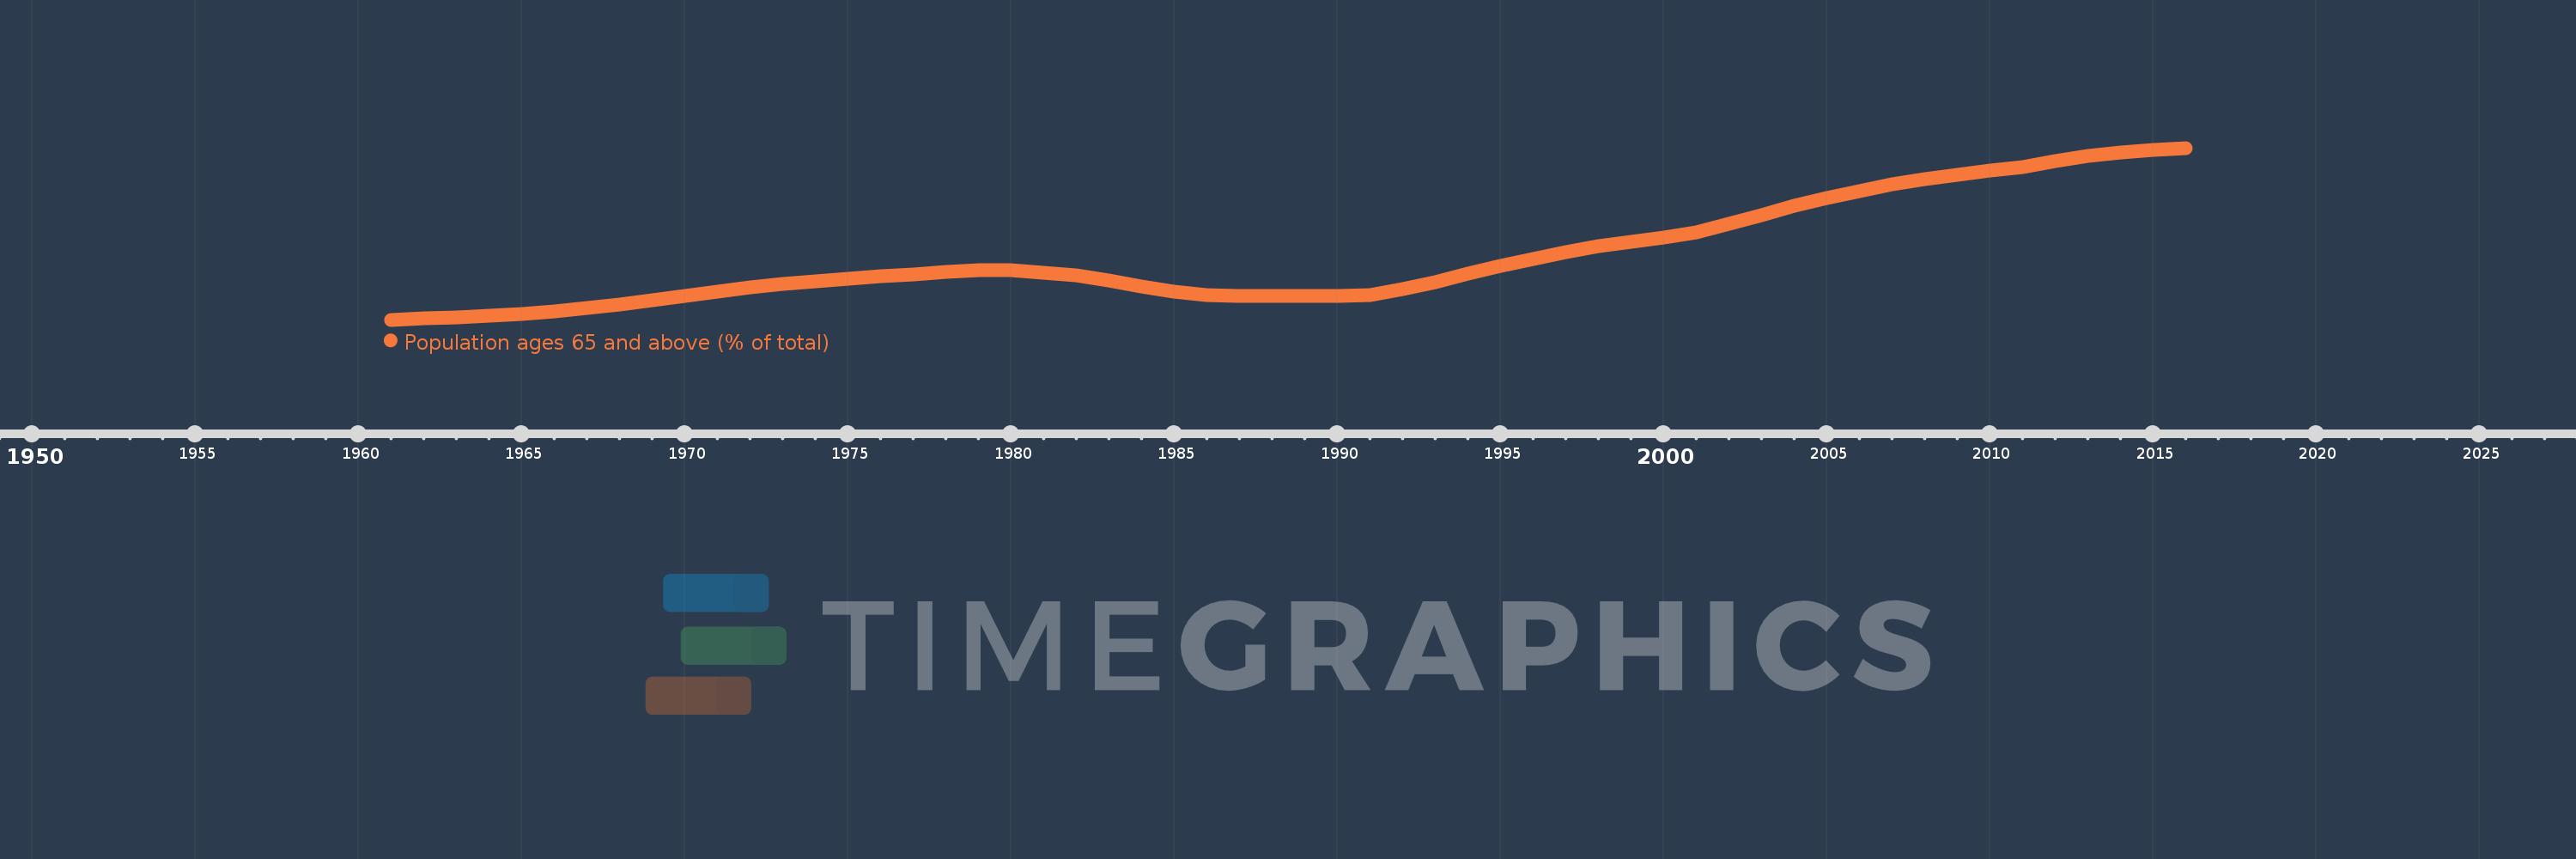
Population ages 65 and above (% of total)
2016,2015,2014,2013,2012,2011,2010,2009,2008,2007,2006,2005,2004,2003,2002,2001,2000,1999,1998,1997,1996,1995,1994,1993,1992,1991,1990,1989,1988,1987,1986,1985,1984,1983,1982,1981,1980,1979,1978,1977,1976,1975,1974,1973,1972,1971,1970,1969,1968,1967,1966,1965,1964,1963,1962,1961
This statistics in other country:
AfghanistanAlbaniaAlgeriaAngolaAntigua and BarbudaArab WorldArgentinaArmeniaArubaAustraliaAustriaAzerbaijanBahamas, TheBahrainBangladeshBarbadosBelarusBelgiumBelizeBeninBhutanBoliviaBosnia and HerzegovinaBotswanaBrazilBrunei DarussalamBulgariaBurkina FasoBurundiCabo VerdeCambodiaCameroonCanadaCaribbean small statesCentral African RepublicCentral Europe and the BalticsChadChannel IslandsChileChinaColombiaComorosCongo, Dem. Rep.Congo, Rep.Costa RicaCote d'IvoireCroatiaCubaCuracaoCyprusCzech RepublicDenmarkDjiboutiDominican RepublicEarly-demographic dividendEast Asia & PacificEast Asia & Pacific (excluding high income)East Asia & Pacific (IDA & IBRD countries)EcuadorEgypt, Arab Rep.El SalvadorEquatorial GuineaEritreaEstoniaEthiopiaEuro areaEurope & Central AsiaEurope & Central Asia (excluding high income)Europe & Central Asia (IDA & IBRD countries)European UnionFijiFinlandFragile and conflict affected situationsFranceFrench PolynesiaGabonGambia, TheGeorgiaGermanyGhanaGreeceGrenadaGuamGuatemalaGuineaGuinea-BissauGuyanaHaitiHeavily indebted poor countries (HIPC)High incomeHondurasHong Kong SAR, ChinaHungaryIBRD onlyIcelandIDA & IBRD totalIDA blendIDA onlyIDA totalIndiaIndonesiaIran, Islamic Rep.IraqIrelandIsraelItalyJamaicaJapanJordanKazakhstanKenyaKiribatiKorea, Dem. People’s Rep.Korea, Rep.KosovoKuwaitKyrgyz RepublicLao PDRLate-demographic dividendLatin America & Caribbean Latin America & Caribbean (excluding high income)Latin America & the Caribbean (IDA & IBRD countries)LatviaLeast developed countries: UN classificationLebanonLesothoLiberiaLibyaLithuaniaLow & middle incomeLow incomeLower middle incomeLuxembourgMacao SAR, ChinaMacedonia, FYRMadagascarMalawiMalaysiaMaldivesMaliMaltaMauritaniaMauritiusMexicoMicronesia, Fed. Sts.Middle East & North AfricaMiddle East & North Africa (excluding high income)Middle East & North Africa (IDA & IBRD countries)Middle incomeMoldovaMongoliaMontenegroMoroccoMozambiqueMyanmarNamibiaNepalNetherlandsNew CaledoniaNew ZealandNicaraguaNigerNigeriaNorth AmericaNorwayOECD membersOmanOther small statesPacific island small statesPakistanPanamaPapua New GuineaParaguayPeruPhilippinesPolandPortugalPost-demographic dividendPre-demographic dividendPuerto RicoQatarRomaniaRussian FederationRwandaSamoaSao Tome and PrincipeSaudi ArabiaSenegalSerbiaSeychellesSierra LeoneSingaporeSlovak RepublicSloveniaSmall statesSolomon IslandsSomaliaSouth AfricaSouth AsiaSouth Asia (IDA & IBRD)South SudanSpainSri LankaSt. LuciaSt. Vincent and the GrenadinesSub-Saharan Africa Sub-Saharan Africa (excluding high income)Sub-Saharan Africa (IDA & IBRD countries)SudanSurinameSwazilandSwedenSwitzerlandSyrian Arab RepublicTajikistanTanzaniaThailandTimor-LesteTogoTongaTrinidad and TobagoTunisiaTurkeyTurkmenistanUgandaUkraineUnited Arab EmiratesUnited KingdomUnited StatesUpper middle incomeUruguayUzbekistanVanuatuVenezuela, RBVietnamVirgin Islands (U.S.)West Bank and GazaWorldYemen, Rep.ZambiaZimbabwe Timeline:
This timeline shows a graph from 1961 to 2016 of Latvia. No data until 1960. Number of actual observations by date: 56.
Source name:
World Development Indicators
Source organization:
World Bank staff estimates based on age distributions of United Nations Population Division's World Population Prospects.
Categories, topics:
Health
Last updated:
apr 23, 2017
Indicators value changes by year
Minimum:
10.583
jan 1, 1961
Maximum:
19.368
jan 1, 2016
At the date of observation
Value
Absolute change
Change from previous value
jan 1, 1961
10.583
+10.583
0.0%
jan 1, 1962
10.65
+0.067
0.63%
jan 1, 1963
10.709
+0.059
0.56%
jan 1, 1964
10.775
+0.065
0.61%
jan 1, 1965
10.865
+0.09
0.84%
jan 1, 1966
10.991
+0.126
1.16%
jan 1, 1967
11.175
+0.184
1.67%
jan 1, 1968
11.378
+0.203
1.82%
jan 1, 1969
11.593
+0.215
1.89%
jan 1, 1970
11.806
+0.213
1.84%
jan 1, 1971
12.009
+0.203
1.72%
jan 1, 1972
12.229
+0.221
1.84%
jan 1, 1973
12.407
+0.177
1.45%
jan 1, 1974
12.551
+0.144
1.16%
jan 1, 1975
12.679
+0.128
1.02%
jan 1, 1976
12.798
+0.119
0.94%
jan 1, 1977
12.91
+0.112
0.88%
jan 1, 1978
13.025
+0.115
0.89%
jan 1, 1979
13.106
+0.081
0.63%
jan 1, 1980
13.097
-0.01
-0.07%
jan 1, 1981
12.969
-0.128
-0.98%
jan 1, 1982
12.84
-0.129
-1.0%
jan 1, 1983
12.594
-0.246
-1.92%
jan 1, 1984
12.292
-0.301
-2.39%
jan 1, 1985
12.023
-0.27
-2.19%
jan 1, 1986
11.832
-0.19
-1.58%
jan 1, 1987
11.797
-0.035
-0.3%
jan 1, 1988
11.787
-0.01
-0.08%
jan 1, 1989
11.789
+0.002
0.02%
jan 1, 1990
11.803
+0.014
0.12%
jan 1, 1991
11.845
+0.042
0.36%
jan 1, 1992
12.143
+0.298
2.52%
jan 1, 1993
12.519
+0.376
3.09%
jan 1, 1994
12.94
+0.421
3.36%
jan 1, 1995
13.349
+0.41
3.17%
jan 1, 1996
13.704
+0.355
2.66%
jan 1, 1997
14.053
+0.349
2.55%
jan 1, 1998
14.329
+0.275
1.96%
jan 1, 1999
14.558
+0.229
1.6%
jan 1, 2000
14.787
+0.229
1.57%
jan 1, 2001
15.039
+0.252
1.7%
jan 1, 2002
15.489
+0.45
2.99%
jan 1, 2003
15.95
+0.461
2.97%
jan 1, 2004
16.402
+0.453
2.84%
jan 1, 2005
16.812
+0.409
2.5%
jan 1, 2006
17.153
+0.342
2.03%
jan 1, 2007
17.489
+0.335
1.95%
jan 1, 2008
17.777
+0.288
1.65%
jan 1, 2009
18.013
+0.237
1.33%
jan 1, 2010
18.207
+0.194
1.07%
jan 1, 2011
18.372
+0.165
0.91%
jan 1, 2012
18.688
+0.316
1.72%
jan 1, 2013
18.949
+0.261
1.4%
jan 1, 2014
19.134
+0.185
0.98%
jan 1, 2015
19.26
+0.126
0.66%
jan 1, 2016
19.368
+0.108
0.56%
Ranking of countries by current statistics by years


Comments: