29
/
en
AIzaSyAYiBZKx7MnpbEhh9jyipgxe19OcubqV5w
April 1, 2024
238644
Seychelles
SYC
true
2
1
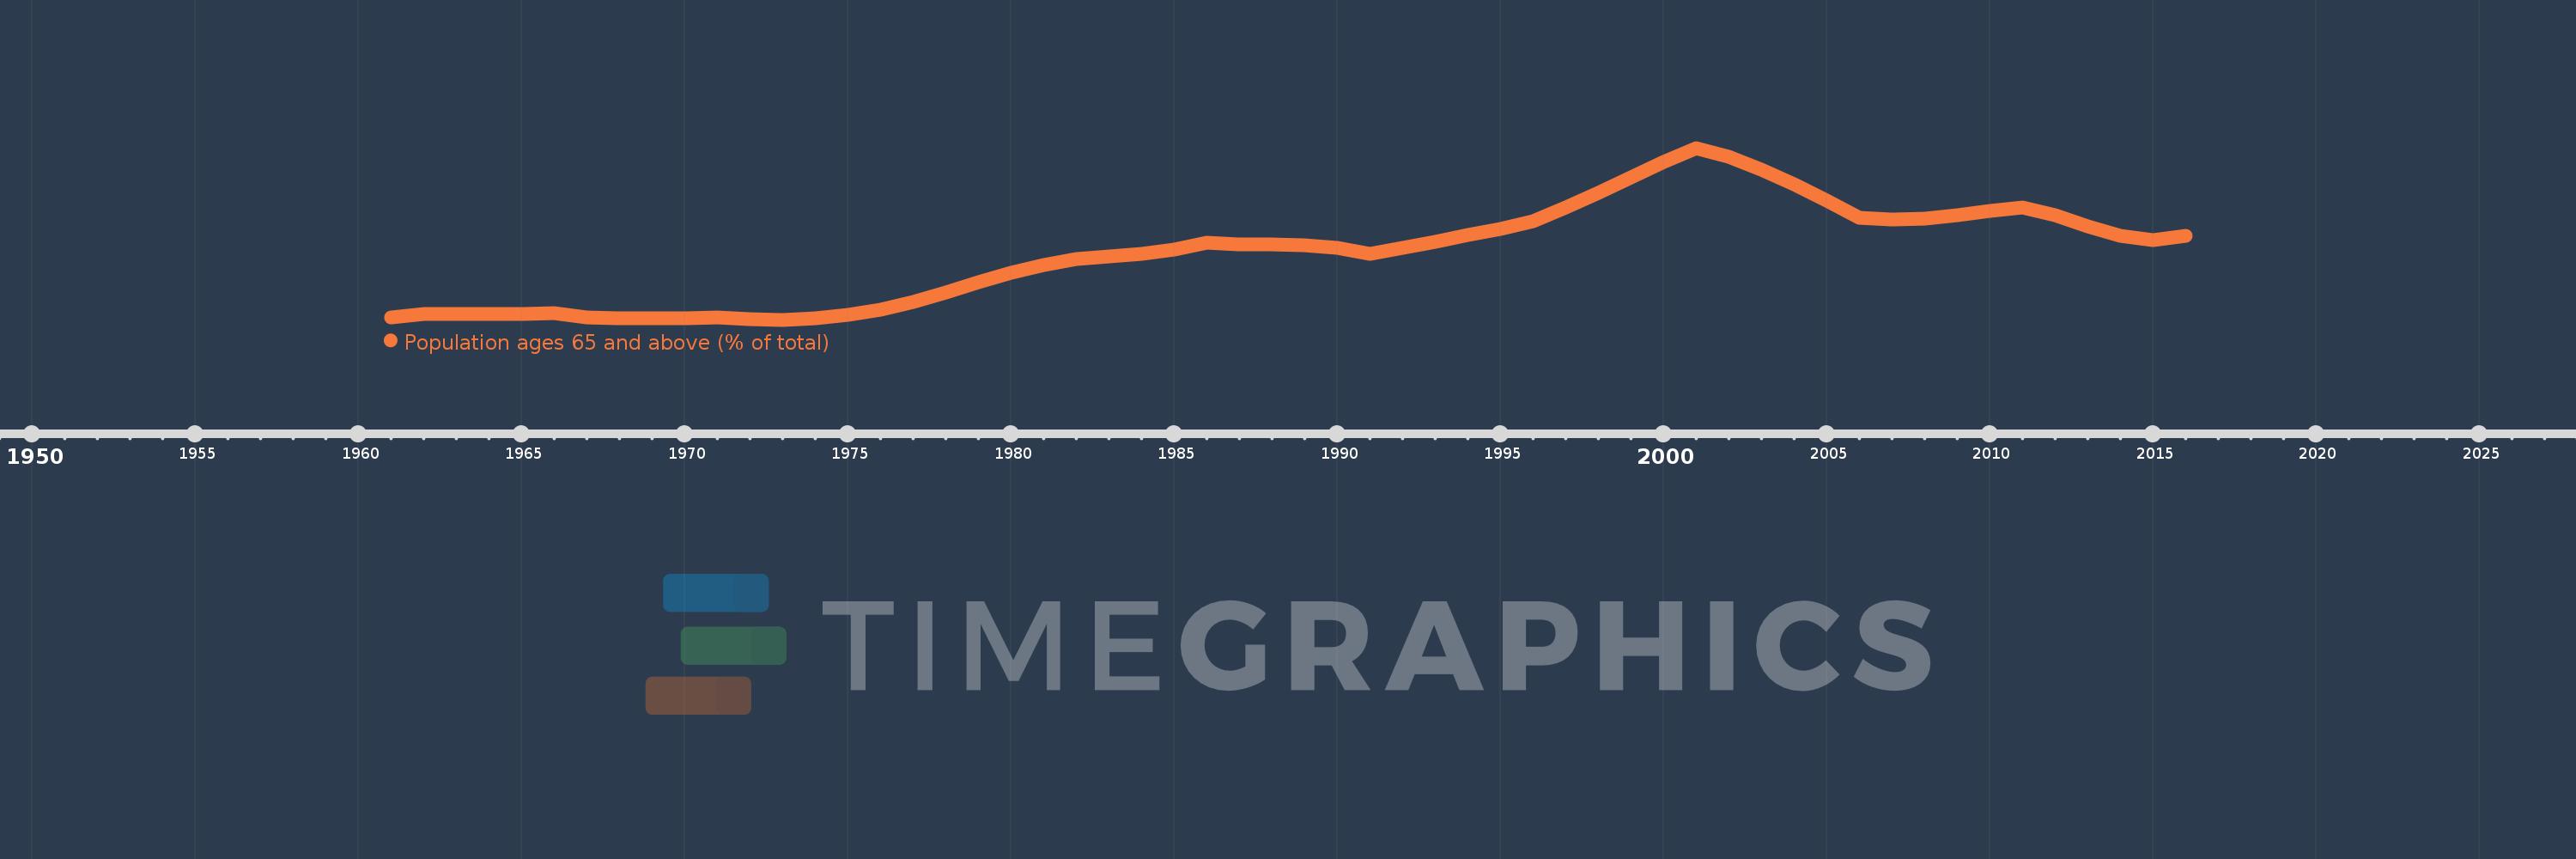
Population ages 65 and above (% of total)
2016,2015,2014,2013,2012,2011,2010,2009,2008,2007,2006,2005,2004,2003,2002,2001,2000,1999,1998,1997,1996,1995,1994,1993,1992,1991,1990,1989,1988,1987,1986,1985,1984,1983,1982,1981,1980,1979,1978,1977,1976,1975,1974,1973,1972,1971,1970,1969,1968,1967,1966,1965,1964,1963,1962,1961
This statistics in other country:
AfghanistanAlbaniaAlgeriaAngolaAntigua and BarbudaArab WorldArgentinaArmeniaArubaAustraliaAustriaAzerbaijanBahamas, TheBahrainBangladeshBarbadosBelarusBelgiumBelizeBeninBhutanBoliviaBosnia and HerzegovinaBotswanaBrazilBrunei DarussalamBulgariaBurkina FasoBurundiCabo VerdeCambodiaCameroonCanadaCaribbean small statesCentral African RepublicCentral Europe and the BalticsChadChannel IslandsChileChinaColombiaComorosCongo, Dem. Rep.Congo, Rep.Costa RicaCote d'IvoireCroatiaCubaCuracaoCyprusCzech RepublicDenmarkDjiboutiDominican RepublicEarly-demographic dividendEast Asia & PacificEast Asia & Pacific (excluding high income)East Asia & Pacific (IDA & IBRD countries)EcuadorEgypt, Arab Rep.El SalvadorEquatorial GuineaEritreaEstoniaEthiopiaEuro areaEurope & Central AsiaEurope & Central Asia (excluding high income)Europe & Central Asia (IDA & IBRD countries)European UnionFijiFinlandFragile and conflict affected situationsFranceFrench PolynesiaGabonGambia, TheGeorgiaGermanyGhanaGreeceGrenadaGuamGuatemalaGuineaGuinea-BissauGuyanaHaitiHeavily indebted poor countries (HIPC)High incomeHondurasHong Kong SAR, ChinaHungaryIBRD onlyIcelandIDA & IBRD totalIDA blendIDA onlyIDA totalIndiaIndonesiaIran, Islamic Rep.IraqIrelandIsraelItalyJamaicaJapanJordanKazakhstanKenyaKiribatiKorea, Dem. People’s Rep.Korea, Rep.KosovoKuwaitKyrgyz RepublicLao PDRLate-demographic dividendLatin America & Caribbean Latin America & Caribbean (excluding high income)Latin America & the Caribbean (IDA & IBRD countries)LatviaLeast developed countries: UN classificationLebanonLesothoLiberiaLibyaLithuaniaLow & middle incomeLow incomeLower middle incomeLuxembourgMacao SAR, ChinaMacedonia, FYRMadagascarMalawiMalaysiaMaldivesMaliMaltaMauritaniaMauritiusMexicoMicronesia, Fed. Sts.Middle East & North AfricaMiddle East & North Africa (excluding high income)Middle East & North Africa (IDA & IBRD countries)Middle incomeMoldovaMongoliaMontenegroMoroccoMozambiqueMyanmarNamibiaNepalNetherlandsNew CaledoniaNew ZealandNicaraguaNigerNigeriaNorth AmericaNorwayOECD membersOmanOther small statesPacific island small statesPakistanPanamaPapua New GuineaParaguayPeruPhilippinesPolandPortugalPost-demographic dividendPre-demographic dividendPuerto RicoQatarRomaniaRussian FederationRwandaSamoaSao Tome and PrincipeSaudi ArabiaSenegalSerbiaSeychellesSierra LeoneSingaporeSlovak RepublicSloveniaSmall statesSolomon IslandsSomaliaSouth AfricaSouth AsiaSouth Asia (IDA & IBRD)South SudanSpainSri LankaSt. LuciaSt. Vincent and the GrenadinesSub-Saharan Africa Sub-Saharan Africa (excluding high income)Sub-Saharan Africa (IDA & IBRD countries)SudanSurinameSwazilandSwedenSwitzerlandSyrian Arab RepublicTajikistanTanzaniaThailandTimor-LesteTogoTongaTrinidad and TobagoTunisiaTurkeyTurkmenistanUgandaUkraineUnited Arab EmiratesUnited KingdomUnited StatesUpper middle incomeUruguayUzbekistanVanuatuVenezuela, RBVietnamVirgin Islands (U.S.)West Bank and GazaWorldYemen, Rep.ZambiaZimbabwe Timeline:
This timeline shows a graph from 1961 to 2016 of Seychelles. No data until 1960. Number of actual observations by date: 56.
Source name:
World Development Indicators
Source organization:
World Bank staff estimates based on age distributions of United Nations Population Division's World Population Prospects.
Categories, topics:
Health
Last updated:
apr 23, 2017
Indicators value changes by year
At the date of observation
Value
Absolute change
Change from previous value
jan 1, 1961
6.04
+6.04
0.0%
jan 1, 1962
6.073
+0.033
0.54%
jan 1, 1963
6.072
0.0
-0.01%
jan 1, 1964
6.07
-0.003
-0.04%
jan 1, 1965
6.07
+0.0
0.0%
jan 1, 1966
6.081
+0.011
0.18%
jan 1, 1967
6.04
-0.041
-0.68%
jan 1, 1968
6.025
-0.014
-0.24%
jan 1, 1969
6.026
+0.001
0.01%
jan 1, 1970
6.03
+0.005
0.08%
jan 1, 1971
6.033
+0.002
0.04%
jan 1, 1972
6.018
-0.015
-0.25%
jan 1, 1973
6.013
-0.005
-0.08%
jan 1, 1974
6.026
+0.013
0.21%
jan 1, 1975
6.06
+0.034
0.57%
jan 1, 1976
6.112
+0.052
0.86%
jan 1, 1977
6.196
+0.084
1.37%
jan 1, 1978
6.291
+0.095
1.54%
jan 1, 1979
6.396
+0.105
1.67%
jan 1, 1980
6.494
+0.098
1.53%
jan 1, 1981
6.575
+0.082
1.26%
jan 1, 1982
6.633
+0.058
0.88%
jan 1, 1983
6.664
+0.03
0.46%
jan 1, 1984
6.69
+0.027
0.4%
jan 1, 1985
6.733
+0.043
0.64%
jan 1, 1986
6.801
+0.068
1.01%
jan 1, 1987
6.79
-0.011
-0.16%
jan 1, 1988
6.786
-0.004
-0.06%
jan 1, 1989
6.777
-0.009
-0.14%
jan 1, 1990
6.748
-0.028
-0.42%
jan 1, 1991
6.691
-0.057
-0.84%
jan 1, 1992
6.75
+0.059
0.87%
jan 1, 1993
6.816
+0.066
0.98%
jan 1, 1994
6.88
+0.064
0.93%
jan 1, 1995
6.949
+0.069
1.0%
jan 1, 1996
7.027
+0.078
1.12%
jan 1, 1997
7.164
+0.137
1.95%
jan 1, 1998
7.313
+0.149
2.08%
jan 1, 1999
7.472
+0.159
2.17%
jan 1, 2000
7.631
+0.159
2.13%
jan 1, 2001
7.778
+0.147
1.92%
jan 1, 2002
7.687
-0.091
-1.17%
jan 1, 2003
7.559
-0.127
-1.66%
jan 1, 2004
7.409
-0.151
-1.99%
jan 1, 2005
7.24
-0.168
-2.27%
jan 1, 2006
7.063
-0.178
-2.45%
jan 1, 2007
7.044
-0.019
-0.27%
jan 1, 2008
7.053
+0.009
0.13%
jan 1, 2009
7.089
+0.036
0.51%
jan 1, 2010
7.133
+0.044
0.62%
jan 1, 2011
7.17
+0.037
0.52%
jan 1, 2012
7.083
-0.087
-1.21%
jan 1, 2013
6.972
-0.112
-1.58%
jan 1, 2014
6.871
-0.101
-1.45%
jan 1, 2015
6.83
-0.041
-0.59%
jan 1, 2016
6.879
+0.049
0.71%
Ranking of countries by current statistics by years


Comments: