29
/
en
AIzaSyAYiBZKx7MnpbEhh9jyipgxe19OcubqV5w
April 1, 2024
278133
Uruguay
URY
true
2
1
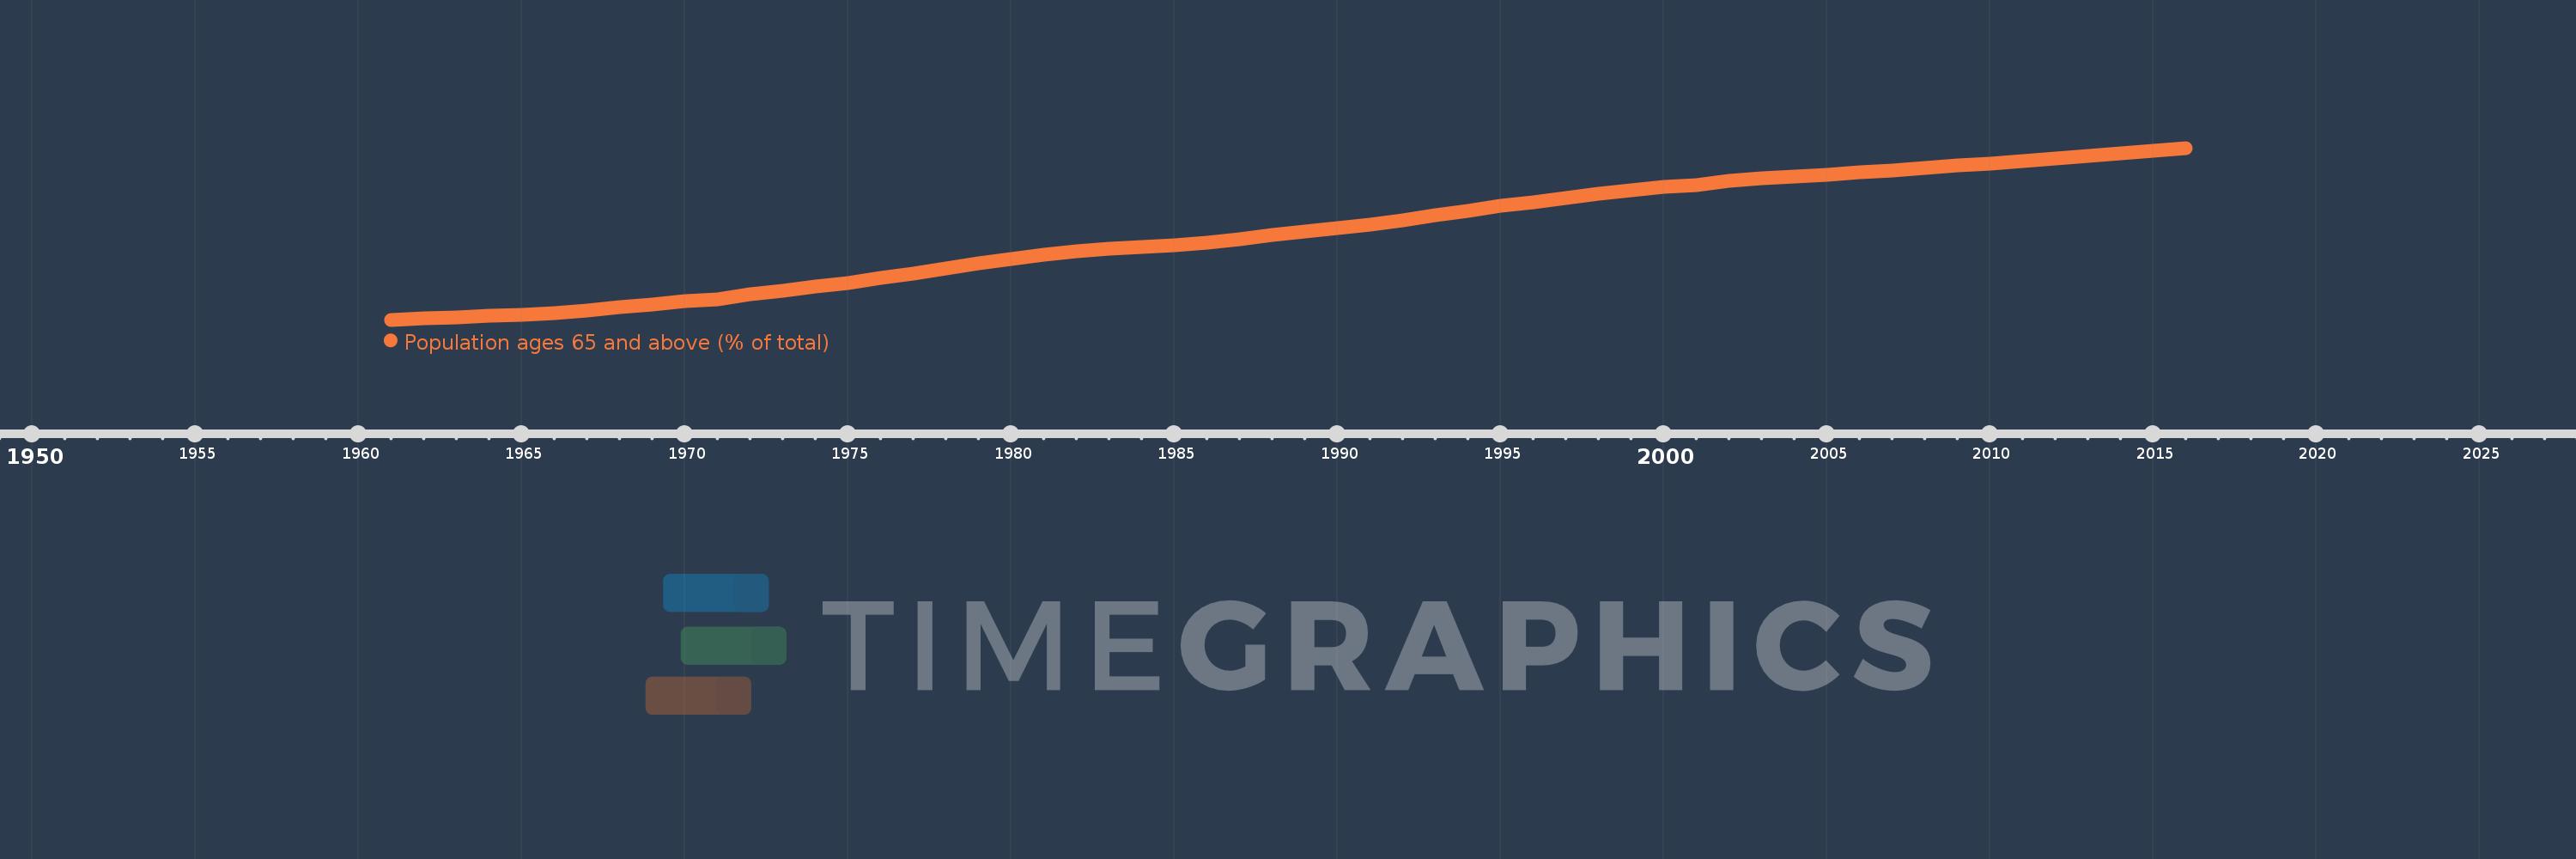
Population ages 65 and above (% of total)
2016,2015,2014,2013,2012,2011,2010,2009,2008,2007,2006,2005,2004,2003,2002,2001,2000,1999,1998,1997,1996,1995,1994,1993,1992,1991,1990,1989,1988,1987,1986,1985,1984,1983,1982,1981,1980,1979,1978,1977,1976,1975,1974,1973,1972,1971,1970,1969,1968,1967,1966,1965,1964,1963,1962,1961
This statistics in other country:
AfghanistanAlbaniaAlgeriaAngolaAntigua and BarbudaArab WorldArgentinaArmeniaArubaAustraliaAustriaAzerbaijanBahamas, TheBahrainBangladeshBarbadosBelarusBelgiumBelizeBeninBhutanBoliviaBosnia and HerzegovinaBotswanaBrazilBrunei DarussalamBulgariaBurkina FasoBurundiCabo VerdeCambodiaCameroonCanadaCaribbean small statesCentral African RepublicCentral Europe and the BalticsChadChannel IslandsChileChinaColombiaComorosCongo, Dem. Rep.Congo, Rep.Costa RicaCote d'IvoireCroatiaCubaCuracaoCyprusCzech RepublicDenmarkDjiboutiDominican RepublicEarly-demographic dividendEast Asia & PacificEast Asia & Pacific (excluding high income)East Asia & Pacific (IDA & IBRD countries)EcuadorEgypt, Arab Rep.El SalvadorEquatorial GuineaEritreaEstoniaEthiopiaEuro areaEurope & Central AsiaEurope & Central Asia (excluding high income)Europe & Central Asia (IDA & IBRD countries)European UnionFijiFinlandFragile and conflict affected situationsFranceFrench PolynesiaGabonGambia, TheGeorgiaGermanyGhanaGreeceGrenadaGuamGuatemalaGuineaGuinea-BissauGuyanaHaitiHeavily indebted poor countries (HIPC)High incomeHondurasHong Kong SAR, ChinaHungaryIBRD onlyIcelandIDA & IBRD totalIDA blendIDA onlyIDA totalIndiaIndonesiaIran, Islamic Rep.IraqIrelandIsraelItalyJamaicaJapanJordanKazakhstanKenyaKiribatiKorea, Dem. People’s Rep.Korea, Rep.KosovoKuwaitKyrgyz RepublicLao PDRLate-demographic dividendLatin America & Caribbean Latin America & Caribbean (excluding high income)Latin America & the Caribbean (IDA & IBRD countries)LatviaLeast developed countries: UN classificationLebanonLesothoLiberiaLibyaLithuaniaLow & middle incomeLow incomeLower middle incomeLuxembourgMacao SAR, ChinaMacedonia, FYRMadagascarMalawiMalaysiaMaldivesMaliMaltaMauritaniaMauritiusMexicoMicronesia, Fed. Sts.Middle East & North AfricaMiddle East & North Africa (excluding high income)Middle East & North Africa (IDA & IBRD countries)Middle incomeMoldovaMongoliaMontenegroMoroccoMozambiqueMyanmarNamibiaNepalNetherlandsNew CaledoniaNew ZealandNicaraguaNigerNigeriaNorth AmericaNorwayOECD membersOmanOther small statesPacific island small statesPakistanPanamaPapua New GuineaParaguayPeruPhilippinesPolandPortugalPost-demographic dividendPre-demographic dividendPuerto RicoQatarRomaniaRussian FederationRwandaSamoaSao Tome and PrincipeSaudi ArabiaSenegalSerbiaSeychellesSierra LeoneSingaporeSlovak RepublicSloveniaSmall statesSolomon IslandsSomaliaSouth AfricaSouth AsiaSouth Asia (IDA & IBRD)South SudanSpainSri LankaSt. LuciaSt. Vincent and the GrenadinesSub-Saharan Africa Sub-Saharan Africa (excluding high income)Sub-Saharan Africa (IDA & IBRD countries)SudanSurinameSwazilandSwedenSwitzerlandSyrian Arab RepublicTajikistanTanzaniaThailandTimor-LesteTogoTongaTrinidad and TobagoTunisiaTurkeyTurkmenistanUgandaUkraineUnited Arab EmiratesUnited KingdomUnited StatesUpper middle incomeUruguayUzbekistanVanuatuVenezuela, RBVietnamVirgin Islands (U.S.)West Bank and GazaWorldYemen, Rep.ZambiaZimbabwe Timeline:
This timeline shows a graph from 1961 to 2016 of Uruguay. No data until 1960. Number of actual observations by date: 56.
Source name:
World Development Indicators
Source organization:
World Bank staff estimates based on age distributions of United Nations Population Division's World Population Prospects.
Categories, topics:
Health
Last updated:
apr 23, 2017
Indicators value changes by year
Maximum:
14.435
jan 1, 2016
At the date of observation
Value
Absolute change
Change from previous value
jan 1, 1961
8.16
+8.16
0.0%
jan 1, 1962
8.211
+0.05
0.62%
jan 1, 1963
8.256
+0.045
0.55%
jan 1, 1964
8.3
+0.044
0.53%
jan 1, 1965
8.346
+0.046
0.56%
jan 1, 1966
8.398
+0.052
0.62%
jan 1, 1967
8.506
+0.108
1.29%
jan 1, 1968
8.618
+0.112
1.31%
jan 1, 1969
8.728
+0.11
1.28%
jan 1, 1970
8.828
+0.1
1.14%
jan 1, 1971
8.914
+0.086
0.98%
jan 1, 1972
9.085
+0.171
1.92%
jan 1, 1973
9.229
+0.144
1.58%
jan 1, 1974
9.363
+0.134
1.45%
jan 1, 1975
9.511
+0.148
1.58%
jan 1, 1976
9.682
+0.171
1.8%
jan 1, 1977
9.843
+0.161
1.66%
jan 1, 1978
10.03
+0.188
1.91%
jan 1, 1979
10.224
+0.193
1.93%
jan 1, 1980
10.392
+0.168
1.65%
jan 1, 1981
10.52
+0.129
1.24%
jan 1, 1982
10.649
+0.129
1.22%
jan 1, 1983
10.743
+0.094
0.88%
jan 1, 1984
10.816
+0.073
0.68%
jan 1, 1985
10.888
+0.072
0.67%
jan 1, 1986
10.972
+0.083
0.77%
jan 1, 1987
11.114
+0.143
1.3%
jan 1, 1988
11.244
+0.13
1.17%
jan 1, 1989
11.37
+0.126
1.12%
jan 1, 1990
11.5
+0.13
1.14%
jan 1, 1991
11.636
+0.136
1.18%
jan 1, 1992
11.805
+0.169
1.45%
jan 1, 1993
11.979
+0.174
1.47%
jan 1, 1994
12.15
+0.171
1.43%
jan 1, 1995
12.308
+0.158
1.3%
jan 1, 1996
12.448
+0.14
1.14%
jan 1, 1997
12.616
+0.168
1.35%
jan 1, 1998
12.77
+0.154
1.22%
jan 1, 1999
12.903
+0.133
1.04%
jan 1, 2000
13.008
+0.106
0.82%
jan 1, 2001
13.086
+0.078
0.6%
jan 1, 2002
13.218
+0.132
1.01%
jan 1, 2003
13.317
+0.099
0.75%
jan 1, 2004
13.395
+0.078
0.59%
jan 1, 2005
13.466
+0.071
0.53%
jan 1, 2006
13.535
+0.069
0.51%
jan 1, 2007
13.622
+0.087
0.65%
jan 1, 2008
13.708
+0.085
0.63%
jan 1, 2009
13.79
+0.082
0.6%
jan 1, 2010
13.868
+0.078
0.57%
jan 1, 2011
13.946
+0.078
0.56%
jan 1, 2012
14.04
+0.094
0.67%
jan 1, 2013
14.135
+0.095
0.68%
jan 1, 2014
14.232
+0.098
0.69%
jan 1, 2015
14.333
+0.1
0.71%
jan 1, 2016
14.435
+0.102
0.71%
Ranking of countries by current statistics by years


Comments: