29
/
en
AIzaSyAYiBZKx7MnpbEhh9jyipgxe19OcubqV5w
April 1, 2024
234005
Sao Tome and Principe
STP
true
2
1
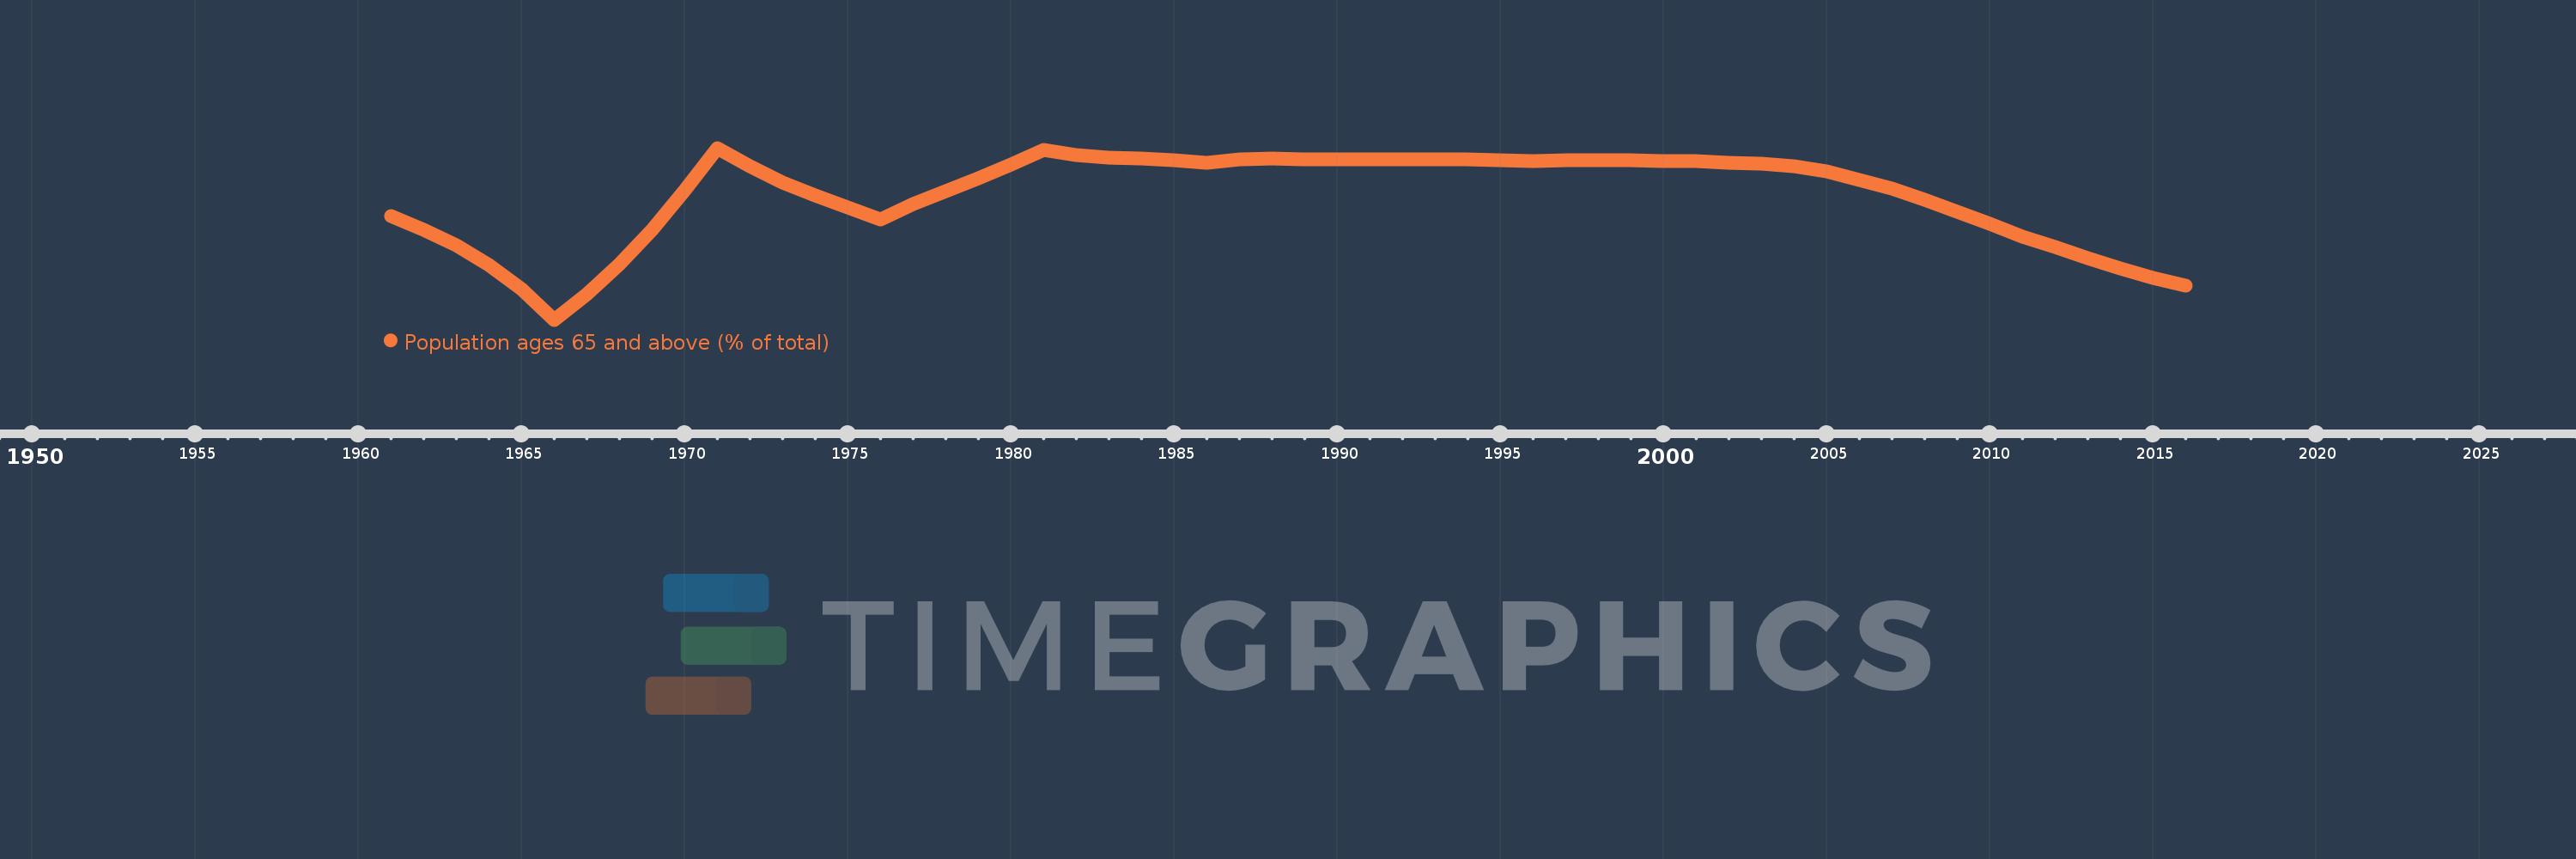
Population ages 65 and above (% of total)
2016,2015,2014,2013,2012,2011,2010,2009,2008,2007,2006,2005,2004,2003,2002,2001,2000,1999,1998,1997,1996,1995,1994,1993,1992,1991,1990,1989,1988,1987,1986,1985,1984,1983,1982,1981,1980,1979,1978,1977,1976,1975,1974,1973,1972,1971,1970,1969,1968,1967,1966,1965,1964,1963,1962,1961
This statistics in other country:
AfghanistanAlbaniaAlgeriaAngolaAntigua and BarbudaArab WorldArgentinaArmeniaArubaAustraliaAustriaAzerbaijanBahamas, TheBahrainBangladeshBarbadosBelarusBelgiumBelizeBeninBhutanBoliviaBosnia and HerzegovinaBotswanaBrazilBrunei DarussalamBulgariaBurkina FasoBurundiCabo VerdeCambodiaCameroonCanadaCaribbean small statesCentral African RepublicCentral Europe and the BalticsChadChannel IslandsChileChinaColombiaComorosCongo, Dem. Rep.Congo, Rep.Costa RicaCote d'IvoireCroatiaCubaCuracaoCyprusCzech RepublicDenmarkDjiboutiDominican RepublicEarly-demographic dividendEast Asia & PacificEast Asia & Pacific (excluding high income)East Asia & Pacific (IDA & IBRD countries)EcuadorEgypt, Arab Rep.El SalvadorEquatorial GuineaEritreaEstoniaEthiopiaEuro areaEurope & Central AsiaEurope & Central Asia (excluding high income)Europe & Central Asia (IDA & IBRD countries)European UnionFijiFinlandFragile and conflict affected situationsFranceFrench PolynesiaGabonGambia, TheGeorgiaGermanyGhanaGreeceGrenadaGuamGuatemalaGuineaGuinea-BissauGuyanaHaitiHeavily indebted poor countries (HIPC)High incomeHondurasHong Kong SAR, ChinaHungaryIBRD onlyIcelandIDA & IBRD totalIDA blendIDA onlyIDA totalIndiaIndonesiaIran, Islamic Rep.IraqIrelandIsraelItalyJamaicaJapanJordanKazakhstanKenyaKiribatiKorea, Dem. People’s Rep.Korea, Rep.KosovoKuwaitKyrgyz RepublicLao PDRLate-demographic dividendLatin America & Caribbean Latin America & Caribbean (excluding high income)Latin America & the Caribbean (IDA & IBRD countries)LatviaLeast developed countries: UN classificationLebanonLesothoLiberiaLibyaLithuaniaLow & middle incomeLow incomeLower middle incomeLuxembourgMacao SAR, ChinaMacedonia, FYRMadagascarMalawiMalaysiaMaldivesMaliMaltaMauritaniaMauritiusMexicoMicronesia, Fed. Sts.Middle East & North AfricaMiddle East & North Africa (excluding high income)Middle East & North Africa (IDA & IBRD countries)Middle incomeMoldovaMongoliaMontenegroMoroccoMozambiqueMyanmarNamibiaNepalNetherlandsNew CaledoniaNew ZealandNicaraguaNigerNigeriaNorth AmericaNorwayOECD membersOmanOther small statesPacific island small statesPakistanPanamaPapua New GuineaParaguayPeruPhilippinesPolandPortugalPost-demographic dividendPre-demographic dividendPuerto RicoQatarRomaniaRussian FederationRwandaSamoaSao Tome and PrincipeSaudi ArabiaSenegalSerbiaSeychellesSierra LeoneSingaporeSlovak RepublicSloveniaSmall statesSolomon IslandsSomaliaSouth AfricaSouth AsiaSouth Asia (IDA & IBRD)South SudanSpainSri LankaSt. LuciaSt. Vincent and the GrenadinesSub-Saharan Africa Sub-Saharan Africa (excluding high income)Sub-Saharan Africa (IDA & IBRD countries)SudanSurinameSwazilandSwedenSwitzerlandSyrian Arab RepublicTajikistanTanzaniaThailandTimor-LesteTogoTongaTrinidad and TobagoTunisiaTurkeyTurkmenistanUgandaUkraineUnited Arab EmiratesUnited KingdomUnited StatesUpper middle incomeUruguayUzbekistanVanuatuVenezuela, RBVietnamVirgin Islands (U.S.)West Bank and GazaWorldYemen, Rep.ZambiaZimbabwe Timeline:
This timeline shows a graph from 1961 to 2016 of Sao Tome and Principe. No data until 1960. Number of actual observations by date: 56.
Source name:
World Development Indicators
Source organization:
World Bank staff estimates based on age distributions of United Nations Population Division's World Population Prospects.
Categories, topics:
Health
Last updated:
apr 23, 2017
Indicators value changes by year
At the date of observation
Value
Absolute change
Change from previous value
jan 1, 1961
3.981
+3.981
0.0%
jan 1, 1962
3.808
-0.173
-4.35%
jan 1, 1963
3.598
-0.21
-5.52%
jan 1, 1964
3.348
-0.249
-6.93%
jan 1, 1965
3.035
-0.313
-9.35%
jan 1, 1966
2.644
-0.392
-12.91%
jan 1, 1967
2.978
+0.334
12.64%
jan 1, 1968
3.358
+0.38
12.76%
jan 1, 1969
3.805
+0.447
13.32%
jan 1, 1970
4.311
+0.506
13.29%
jan 1, 1971
4.857
+0.546
12.66%
jan 1, 1972
4.619
-0.237
-4.89%
jan 1, 1973
4.412
-0.207
-4.48%
jan 1, 1974
4.24
-0.172
-3.89%
jan 1, 1975
4.086
-0.155
-3.65%
jan 1, 1976
3.937
-0.149
-3.65%
jan 1, 1977
4.132
+0.196
4.97%
jan 1, 1978
4.303
+0.17
4.12%
jan 1, 1979
4.47
+0.167
3.88%
jan 1, 1980
4.645
+0.176
3.93%
jan 1, 1981
4.836
+0.191
4.11%
jan 1, 1982
4.769
-0.067
-1.4%
jan 1, 1983
4.735
-0.034
-0.71%
jan 1, 1984
4.721
-0.014
-0.3%
jan 1, 1985
4.699
-0.021
-0.45%
jan 1, 1986
4.671
-0.028
-0.6%
jan 1, 1987
4.707
+0.036
0.76%
jan 1, 1988
4.719
+0.013
0.27%
jan 1, 1989
4.714
-0.005
-0.11%
jan 1, 1990
4.709
-0.005
-0.1%
jan 1, 1991
4.708
-0.001
-0.03%
jan 1, 1992
4.706
-0.002
-0.05%
jan 1, 1993
4.71
+0.004
0.09%
jan 1, 1994
4.712
+0.002
0.04%
jan 1, 1995
4.703
-0.008
-0.18%
jan 1, 1996
4.687
-0.017
-0.35%
jan 1, 1997
4.701
+0.014
0.31%
jan 1, 1998
4.702
+0.001
0.02%
jan 1, 1999
4.697
-0.005
-0.1%
jan 1, 2000
4.693
-0.004
-0.09%
jan 1, 2001
4.689
-0.005
-0.1%
jan 1, 2002
4.67
-0.019
-0.4%
jan 1, 2003
4.651
-0.019
-0.4%
jan 1, 2004
4.617
-0.034
-0.72%
jan 1, 2005
4.551
-0.067
-1.44%
jan 1, 2006
4.446
-0.105
-2.3%
jan 1, 2007
4.333
-0.113
-2.54%
jan 1, 2008
4.195
-0.139
-3.2%
jan 1, 2009
4.039
-0.156
-3.72%
jan 1, 2010
3.876
-0.162
-4.02%
jan 1, 2011
3.714
-0.163
-4.19%
jan 1, 2012
3.579
-0.134
-3.62%
jan 1, 2013
3.442
-0.137
-3.83%
jan 1, 2014
3.309
-0.133
-3.86%
jan 1, 2015
3.188
-0.121
-3.66%
jan 1, 2016
3.085
-0.103
-3.22%
Ranking of countries by current statistics by years


Comments: