29
/
en
AIzaSyAYiBZKx7MnpbEhh9jyipgxe19OcubqV5w
April 1, 2024
153916
Iceland
ISL
true
2
1
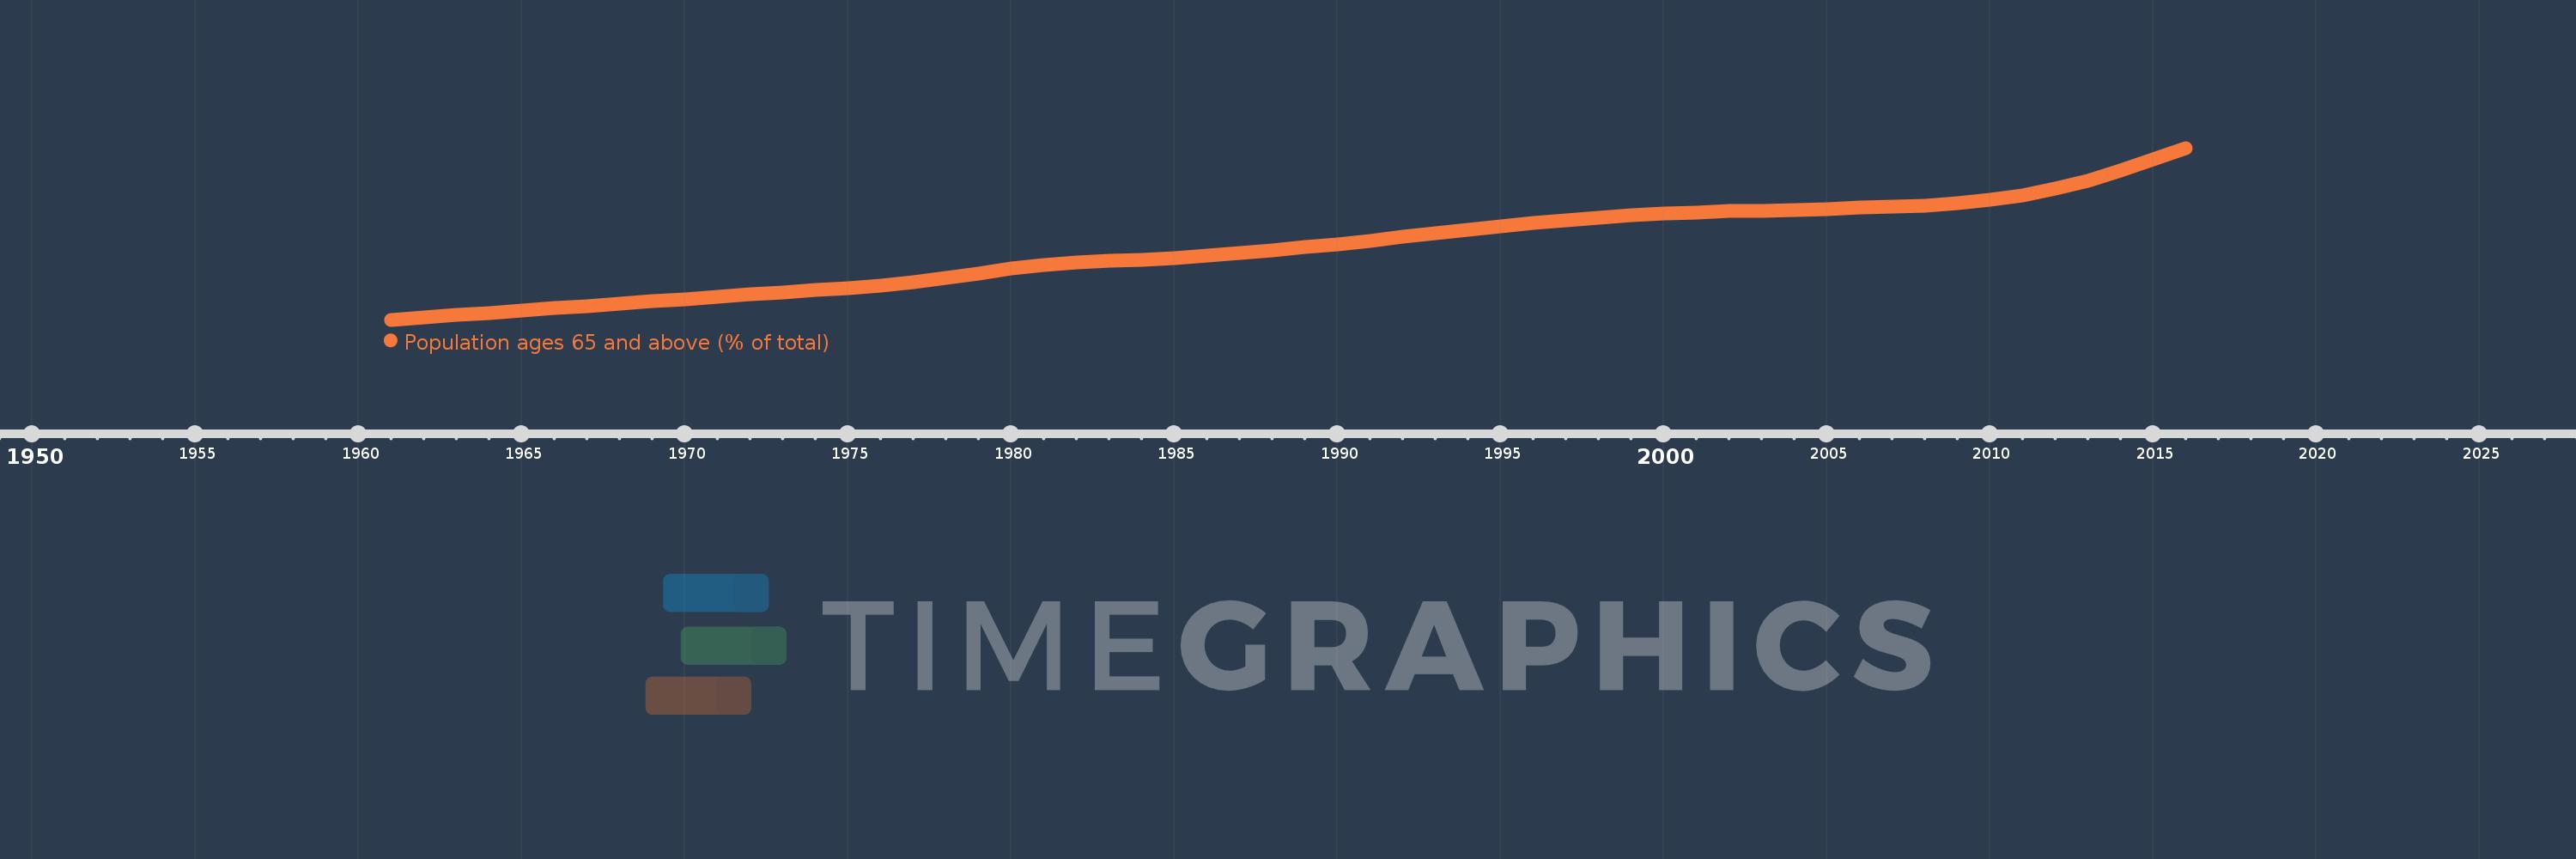
Population ages 65 and above (% of total)
2016,2015,2014,2013,2012,2011,2010,2009,2008,2007,2006,2005,2004,2003,2002,2001,2000,1999,1998,1997,1996,1995,1994,1993,1992,1991,1990,1989,1988,1987,1986,1985,1984,1983,1982,1981,1980,1979,1978,1977,1976,1975,1974,1973,1972,1971,1970,1969,1968,1967,1966,1965,1964,1963,1962,1961
This statistics in other country:
AfghanistanAlbaniaAlgeriaAngolaAntigua and BarbudaArab WorldArgentinaArmeniaArubaAustraliaAustriaAzerbaijanBahamas, TheBahrainBangladeshBarbadosBelarusBelgiumBelizeBeninBhutanBoliviaBosnia and HerzegovinaBotswanaBrazilBrunei DarussalamBulgariaBurkina FasoBurundiCabo VerdeCambodiaCameroonCanadaCaribbean small statesCentral African RepublicCentral Europe and the BalticsChadChannel IslandsChileChinaColombiaComorosCongo, Dem. Rep.Congo, Rep.Costa RicaCote d'IvoireCroatiaCubaCuracaoCyprusCzech RepublicDenmarkDjiboutiDominican RepublicEarly-demographic dividendEast Asia & PacificEast Asia & Pacific (excluding high income)East Asia & Pacific (IDA & IBRD countries)EcuadorEgypt, Arab Rep.El SalvadorEquatorial GuineaEritreaEstoniaEthiopiaEuro areaEurope & Central AsiaEurope & Central Asia (excluding high income)Europe & Central Asia (IDA & IBRD countries)European UnionFijiFinlandFragile and conflict affected situationsFranceFrench PolynesiaGabonGambia, TheGeorgiaGermanyGhanaGreeceGrenadaGuamGuatemalaGuineaGuinea-BissauGuyanaHaitiHeavily indebted poor countries (HIPC)High incomeHondurasHong Kong SAR, ChinaHungaryIBRD onlyIcelandIDA & IBRD totalIDA blendIDA onlyIDA totalIndiaIndonesiaIran, Islamic Rep.IraqIrelandIsraelItalyJamaicaJapanJordanKazakhstanKenyaKiribatiKorea, Dem. People’s Rep.Korea, Rep.KosovoKuwaitKyrgyz RepublicLao PDRLate-demographic dividendLatin America & Caribbean Latin America & Caribbean (excluding high income)Latin America & the Caribbean (IDA & IBRD countries)LatviaLeast developed countries: UN classificationLebanonLesothoLiberiaLibyaLithuaniaLow & middle incomeLow incomeLower middle incomeLuxembourgMacao SAR, ChinaMacedonia, FYRMadagascarMalawiMalaysiaMaldivesMaliMaltaMauritaniaMauritiusMexicoMicronesia, Fed. Sts.Middle East & North AfricaMiddle East & North Africa (excluding high income)Middle East & North Africa (IDA & IBRD countries)Middle incomeMoldovaMongoliaMontenegroMoroccoMozambiqueMyanmarNamibiaNepalNetherlandsNew CaledoniaNew ZealandNicaraguaNigerNigeriaNorth AmericaNorwayOECD membersOmanOther small statesPacific island small statesPakistanPanamaPapua New GuineaParaguayPeruPhilippinesPolandPortugalPost-demographic dividendPre-demographic dividendPuerto RicoQatarRomaniaRussian FederationRwandaSamoaSao Tome and PrincipeSaudi ArabiaSenegalSerbiaSeychellesSierra LeoneSingaporeSlovak RepublicSloveniaSmall statesSolomon IslandsSomaliaSouth AfricaSouth AsiaSouth Asia (IDA & IBRD)South SudanSpainSri LankaSt. LuciaSt. Vincent and the GrenadinesSub-Saharan Africa Sub-Saharan Africa (excluding high income)Sub-Saharan Africa (IDA & IBRD countries)SudanSurinameSwazilandSwedenSwitzerlandSyrian Arab RepublicTajikistanTanzaniaThailandTimor-LesteTogoTongaTrinidad and TobagoTunisiaTurkeyTurkmenistanUgandaUkraineUnited Arab EmiratesUnited KingdomUnited StatesUpper middle incomeUruguayUzbekistanVanuatuVenezuela, RBVietnamVirgin Islands (U.S.)West Bank and GazaWorldYemen, Rep.ZambiaZimbabwe Timeline:
This timeline shows a graph from 1961 to 2016 of Iceland. No data until 1960. Number of actual observations by date: 56.
Source name:
World Development Indicators
Source organization:
World Bank staff estimates based on age distributions of United Nations Population Division's World Population Prospects.
Categories, topics:
Health
Last updated:
apr 23, 2017
Indicators value changes by year
Maximum:
13.714
jan 1, 2016
At the date of observation
Value
Absolute change
Change from previous value
jan 1, 1961
8.041
+8.041
0.0%
jan 1, 1962
8.117
+0.076
0.94%
jan 1, 1963
8.19
+0.073
0.9%
jan 1, 1964
8.263
+0.073
0.89%
jan 1, 1965
8.34
+0.077
0.93%
jan 1, 1966
8.419
+0.079
0.95%
jan 1, 1967
8.498
+0.079
0.94%
jan 1, 1968
8.574
+0.076
0.9%
jan 1, 1969
8.646
+0.072
0.85%
jan 1, 1970
8.717
+0.071
0.82%
jan 1, 1971
8.786
+0.068
0.78%
jan 1, 1972
8.875
+0.089
1.01%
jan 1, 1973
8.949
+0.075
0.84%
jan 1, 1974
9.015
+0.065
0.73%
jan 1, 1975
9.08
+0.066
0.73%
jan 1, 1976
9.154
+0.074
0.81%
jan 1, 1977
9.285
+0.131
1.43%
jan 1, 1978
9.428
+0.143
1.54%
jan 1, 1979
9.578
+0.15
1.59%
jan 1, 1980
9.722
+0.145
1.51%
jan 1, 1981
9.86
+0.137
1.41%
jan 1, 1982
9.925
+0.065
0.66%
jan 1, 1983
9.977
+0.052
0.53%
jan 1, 1984
10.025
+0.048
0.48%
jan 1, 1985
10.082
+0.057
0.57%
jan 1, 1986
10.154
+0.072
0.71%
jan 1, 1987
10.233
+0.079
0.78%
jan 1, 1988
10.328
+0.095
0.93%
jan 1, 1989
10.434
+0.106
1.03%
jan 1, 1990
10.542
+0.108
1.04%
jan 1, 1991
10.649
+0.106
1.01%
jan 1, 1992
10.773
+0.125
1.17%
jan 1, 1993
10.892
+0.118
1.1%
jan 1, 1994
11.007
+0.115
1.06%
jan 1, 1995
11.125
+0.118
1.07%
jan 1, 1996
11.245
+0.12
1.08%
jan 1, 1997
11.313
+0.068
0.6%
jan 1, 1998
11.397
+0.083
0.74%
jan 1, 1999
11.481
+0.085
0.74%
jan 1, 2000
11.548
+0.067
0.58%
jan 1, 2001
11.585
+0.037
0.32%
jan 1, 2002
11.626
+0.042
0.36%
jan 1, 2003
11.644
+0.018
0.15%
jan 1, 2004
11.655
+0.011
0.09%
jan 1, 2005
11.685
+0.03
0.26%
jan 1, 2006
11.747
+0.062
0.53%
jan 1, 2007
11.766
+0.018
0.15%
jan 1, 2008
11.808
+0.043
0.36%
jan 1, 2009
11.881
+0.073
0.62%
jan 1, 2010
11.992
+0.111
0.93%
jan 1, 2011
12.146
+0.154
1.28%
jan 1, 2012
12.363
+0.218
1.79%
jan 1, 2013
12.64
+0.276
2.24%
jan 1, 2014
12.969
+0.329
2.61%
jan 1, 2015
13.333
+0.364
2.8%
jan 1, 2016
13.714
+0.381
2.86%
Ranking of countries by current statistics by years


Comments: