29
/
en
AIzaSyAYiBZKx7MnpbEhh9jyipgxe19OcubqV5w
April 1, 2024
63933
Afghanistan
AFG
true
2
1
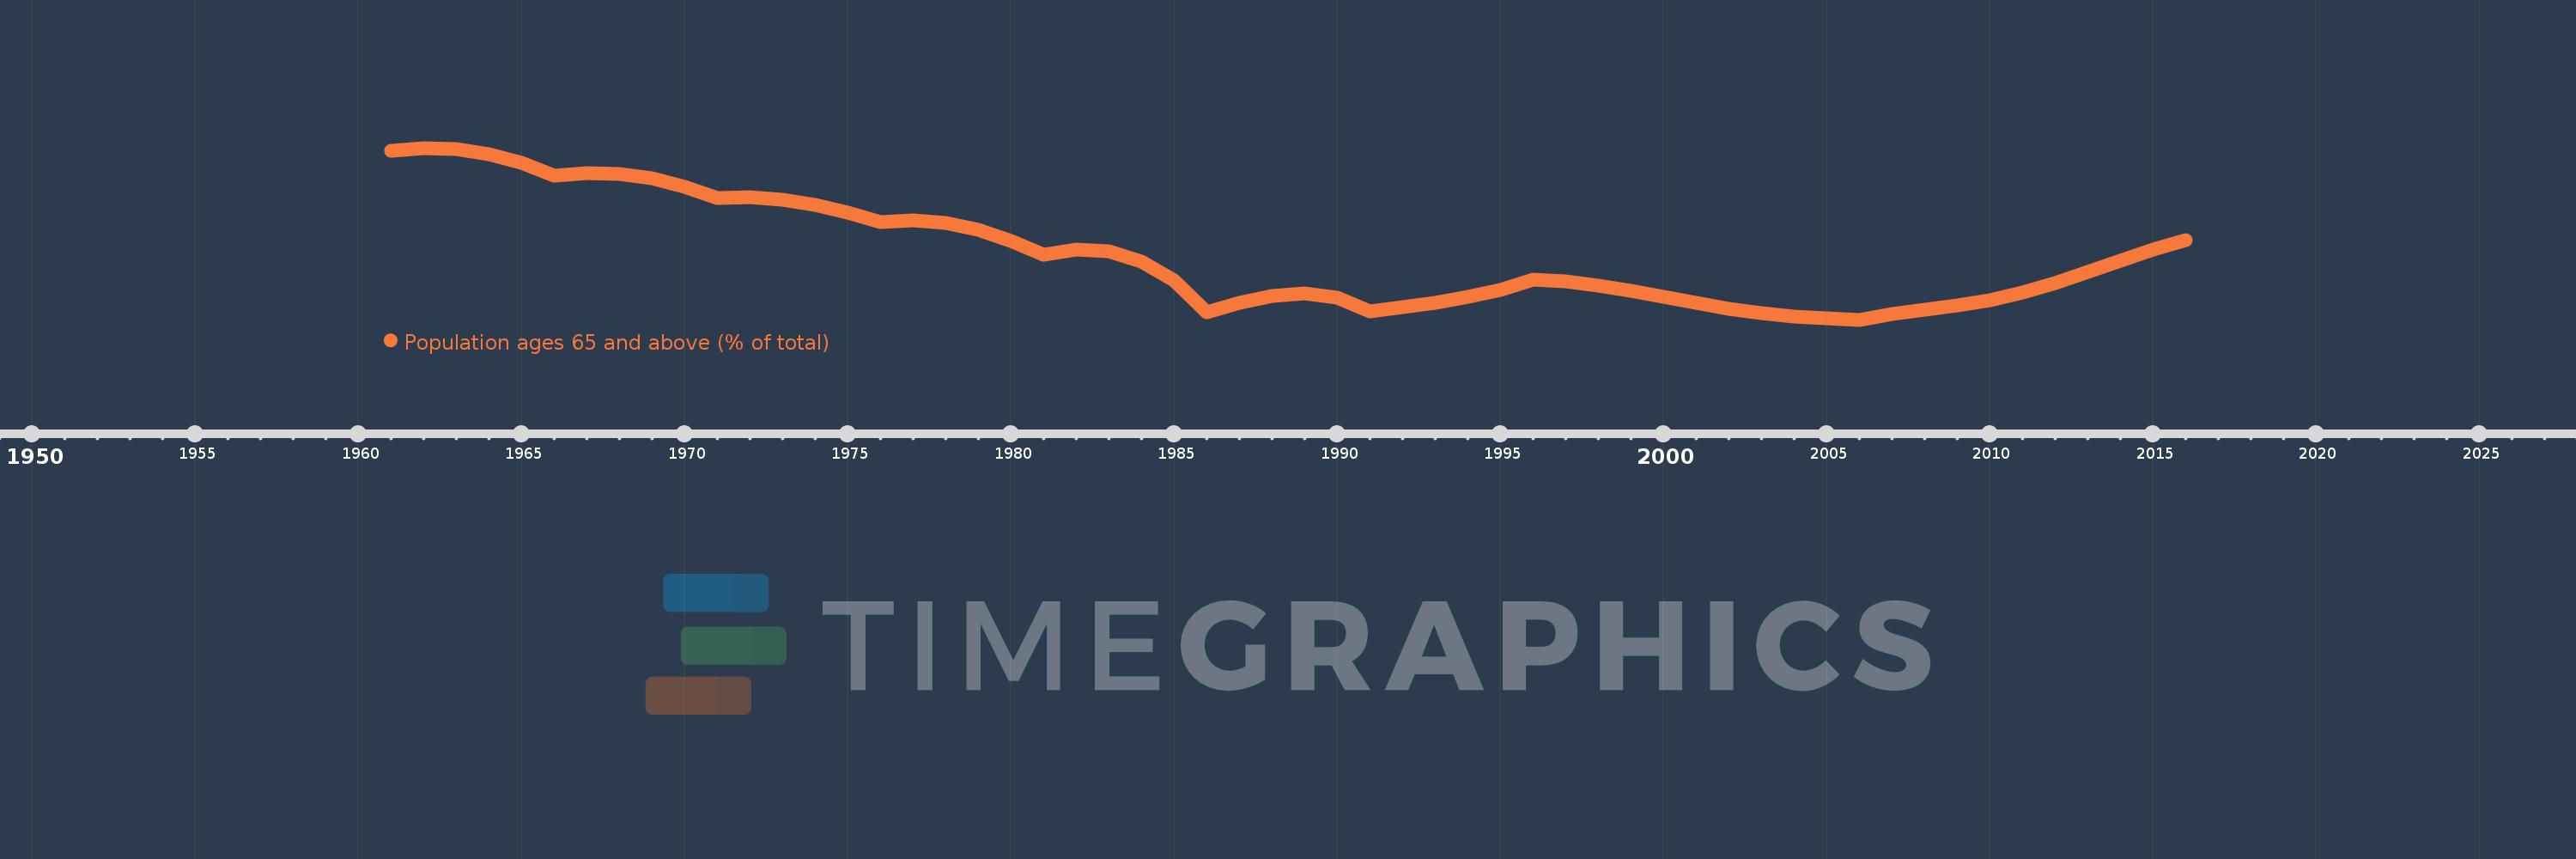
Population ages 65 and above (% of total)
2016,2015,2014,2013,2012,2011,2010,2009,2008,2007,2006,2005,2004,2003,2002,2001,2000,1999,1998,1997,1996,1995,1994,1993,1992,1991,1990,1989,1988,1987,1986,1985,1984,1983,1982,1981,1980,1979,1978,1977,1976,1975,1974,1973,1972,1971,1970,1969,1968,1967,1966,1965,1964,1963,1962,1961
This statistics in other country:
AfghanistanAlbaniaAlgeriaAngolaAntigua and BarbudaArab WorldArgentinaArmeniaArubaAustraliaAustriaAzerbaijanBahamas, TheBahrainBangladeshBarbadosBelarusBelgiumBelizeBeninBhutanBoliviaBosnia and HerzegovinaBotswanaBrazilBrunei DarussalamBulgariaBurkina FasoBurundiCabo VerdeCambodiaCameroonCanadaCaribbean small statesCentral African RepublicCentral Europe and the BalticsChadChannel IslandsChileChinaColombiaComorosCongo, Dem. Rep.Congo, Rep.Costa RicaCote d'IvoireCroatiaCubaCuracaoCyprusCzech RepublicDenmarkDjiboutiDominican RepublicEarly-demographic dividendEast Asia & PacificEast Asia & Pacific (excluding high income)East Asia & Pacific (IDA & IBRD countries)EcuadorEgypt, Arab Rep.El SalvadorEquatorial GuineaEritreaEstoniaEthiopiaEuro areaEurope & Central AsiaEurope & Central Asia (excluding high income)Europe & Central Asia (IDA & IBRD countries)European UnionFijiFinlandFragile and conflict affected situationsFranceFrench PolynesiaGabonGambia, TheGeorgiaGermanyGhanaGreeceGrenadaGuamGuatemalaGuineaGuinea-BissauGuyanaHaitiHeavily indebted poor countries (HIPC)High incomeHondurasHong Kong SAR, ChinaHungaryIBRD onlyIcelandIDA & IBRD totalIDA blendIDA onlyIDA totalIndiaIndonesiaIran, Islamic Rep.IraqIrelandIsraelItalyJamaicaJapanJordanKazakhstanKenyaKiribatiKorea, Dem. People’s Rep.Korea, Rep.KosovoKuwaitKyrgyz RepublicLao PDRLate-demographic dividendLatin America & Caribbean Latin America & Caribbean (excluding high income)Latin America & the Caribbean (IDA & IBRD countries)LatviaLeast developed countries: UN classificationLebanonLesothoLiberiaLibyaLithuaniaLow & middle incomeLow incomeLower middle incomeLuxembourgMacao SAR, ChinaMacedonia, FYRMadagascarMalawiMalaysiaMaldivesMaliMaltaMauritaniaMauritiusMexicoMicronesia, Fed. Sts.Middle East & North AfricaMiddle East & North Africa (excluding high income)Middle East & North Africa (IDA & IBRD countries)Middle incomeMoldovaMongoliaMontenegroMoroccoMozambiqueMyanmarNamibiaNepalNetherlandsNew CaledoniaNew ZealandNicaraguaNigerNigeriaNorth AmericaNorwayOECD membersOmanOther small statesPacific island small statesPakistanPanamaPapua New GuineaParaguayPeruPhilippinesPolandPortugalPost-demographic dividendPre-demographic dividendPuerto RicoQatarRomaniaRussian FederationRwandaSamoaSao Tome and PrincipeSaudi ArabiaSenegalSerbiaSeychellesSierra LeoneSingaporeSlovak RepublicSloveniaSmall statesSolomon IslandsSomaliaSouth AfricaSouth AsiaSouth Asia (IDA & IBRD)South SudanSpainSri LankaSt. LuciaSt. Vincent and the GrenadinesSub-Saharan Africa Sub-Saharan Africa (excluding high income)Sub-Saharan Africa (IDA & IBRD countries)SudanSurinameSwazilandSwedenSwitzerlandSyrian Arab RepublicTajikistanTanzaniaThailandTimor-LesteTogoTongaTrinidad and TobagoTunisiaTurkeyTurkmenistanUgandaUkraineUnited Arab EmiratesUnited KingdomUnited StatesUpper middle incomeUruguayUzbekistanVanuatuVenezuela, RBVietnamVirgin Islands (U.S.)West Bank and GazaWorldYemen, Rep.ZambiaZimbabwe Timeline:
This timeline shows a graph from 1961 to 2016 of Afghanistan. No data until 1960. Number of actual observations by date: 56.
Source name:
World Development Indicators
Source organization:
World Bank staff estimates based on age distributions of United Nations Population Division's World Population Prospects.
Categories, topics:
Health
Last updated:
apr 23, 2017
Indicators value changes by year
At the date of observation
Value
Absolute change
Change from previous value
jan 1, 1961
2.799
+2.799
0.0%
jan 1, 1962
2.808
+0.009
0.34%
jan 1, 1963
2.804
-0.005
-0.17%
jan 1, 1964
2.785
-0.019
-0.67%
jan 1, 1965
2.752
-0.033
-1.19%
jan 1, 1966
2.705
-0.047
-1.7%
jan 1, 1967
2.714
+0.009
0.35%
jan 1, 1968
2.711
-0.003
-0.11%
jan 1, 1969
2.695
-0.016
-0.59%
jan 1, 1970
2.666
-0.03
-1.1%
jan 1, 1971
2.623
-0.043
-1.62%
jan 1, 1972
2.626
+0.003
0.13%
jan 1, 1973
2.617
-0.008
-0.32%
jan 1, 1974
2.598
-0.019
-0.73%
jan 1, 1975
2.571
-0.028
-1.07%
jan 1, 1976
2.536
-0.034
-1.33%
jan 1, 1977
2.543
+0.007
0.27%
jan 1, 1978
2.533
-0.01
-0.38%
jan 1, 1979
2.508
-0.026
-1.02%
jan 1, 1980
2.467
-0.04
-1.6%
jan 1, 1981
2.415
-0.053
-2.13%
jan 1, 1982
2.433
+0.018
0.76%
jan 1, 1983
2.427
-0.007
-0.27%
jan 1, 1984
2.391
-0.036
-1.47%
jan 1, 1985
2.32
-0.071
-2.98%
jan 1, 1986
2.204
-0.116
-4.98%
jan 1, 1987
2.239
+0.034
1.56%
jan 1, 1988
2.263
+0.025
1.11%
jan 1, 1989
2.273
+0.009
0.4%
jan 1, 1990
2.257
-0.016
-0.7%
jan 1, 1991
2.207
-0.05
-2.2%
jan 1, 1992
2.221
+0.014
0.64%
jan 1, 1993
2.239
+0.017
0.78%
jan 1, 1994
2.259
+0.02
0.91%
jan 1, 1995
2.285
+0.026
1.15%
jan 1, 1996
2.322
+0.037
1.6%
jan 1, 1997
2.317
-0.004
-0.19%
jan 1, 1998
2.303
-0.014
-0.62%
jan 1, 1999
2.283
-0.02
-0.86%
jan 1, 2000
2.261
-0.022
-0.97%
jan 1, 2001
2.237
-0.024
-1.07%
jan 1, 2002
2.217
-0.02
-0.91%
jan 1, 2003
2.201
-0.016
-0.72%
jan 1, 2004
2.189
-0.012
-0.54%
jan 1, 2005
2.18
-0.008
-0.38%
jan 1, 2006
2.176
-0.004
-0.2%
jan 1, 2007
2.197
+0.021
0.96%
jan 1, 2008
2.213
+0.016
0.74%
jan 1, 2009
2.229
+0.015
0.7%
jan 1, 2010
2.248
+0.02
0.89%
jan 1, 2011
2.275
+0.027
1.19%
jan 1, 2012
2.31
+0.034
1.51%
jan 1, 2013
2.351
+0.041
1.78%
jan 1, 2014
2.394
+0.044
1.85%
jan 1, 2015
2.435
+0.04
1.68%
jan 1, 2016
2.469
+0.034
1.41%
Ranking of countries by current statistics by years


Comments: