29
/
en
AIzaSyAYiBZKx7MnpbEhh9jyipgxe19OcubqV5w
April 1, 2024
36910
IBRD only
IBD
false
2
1
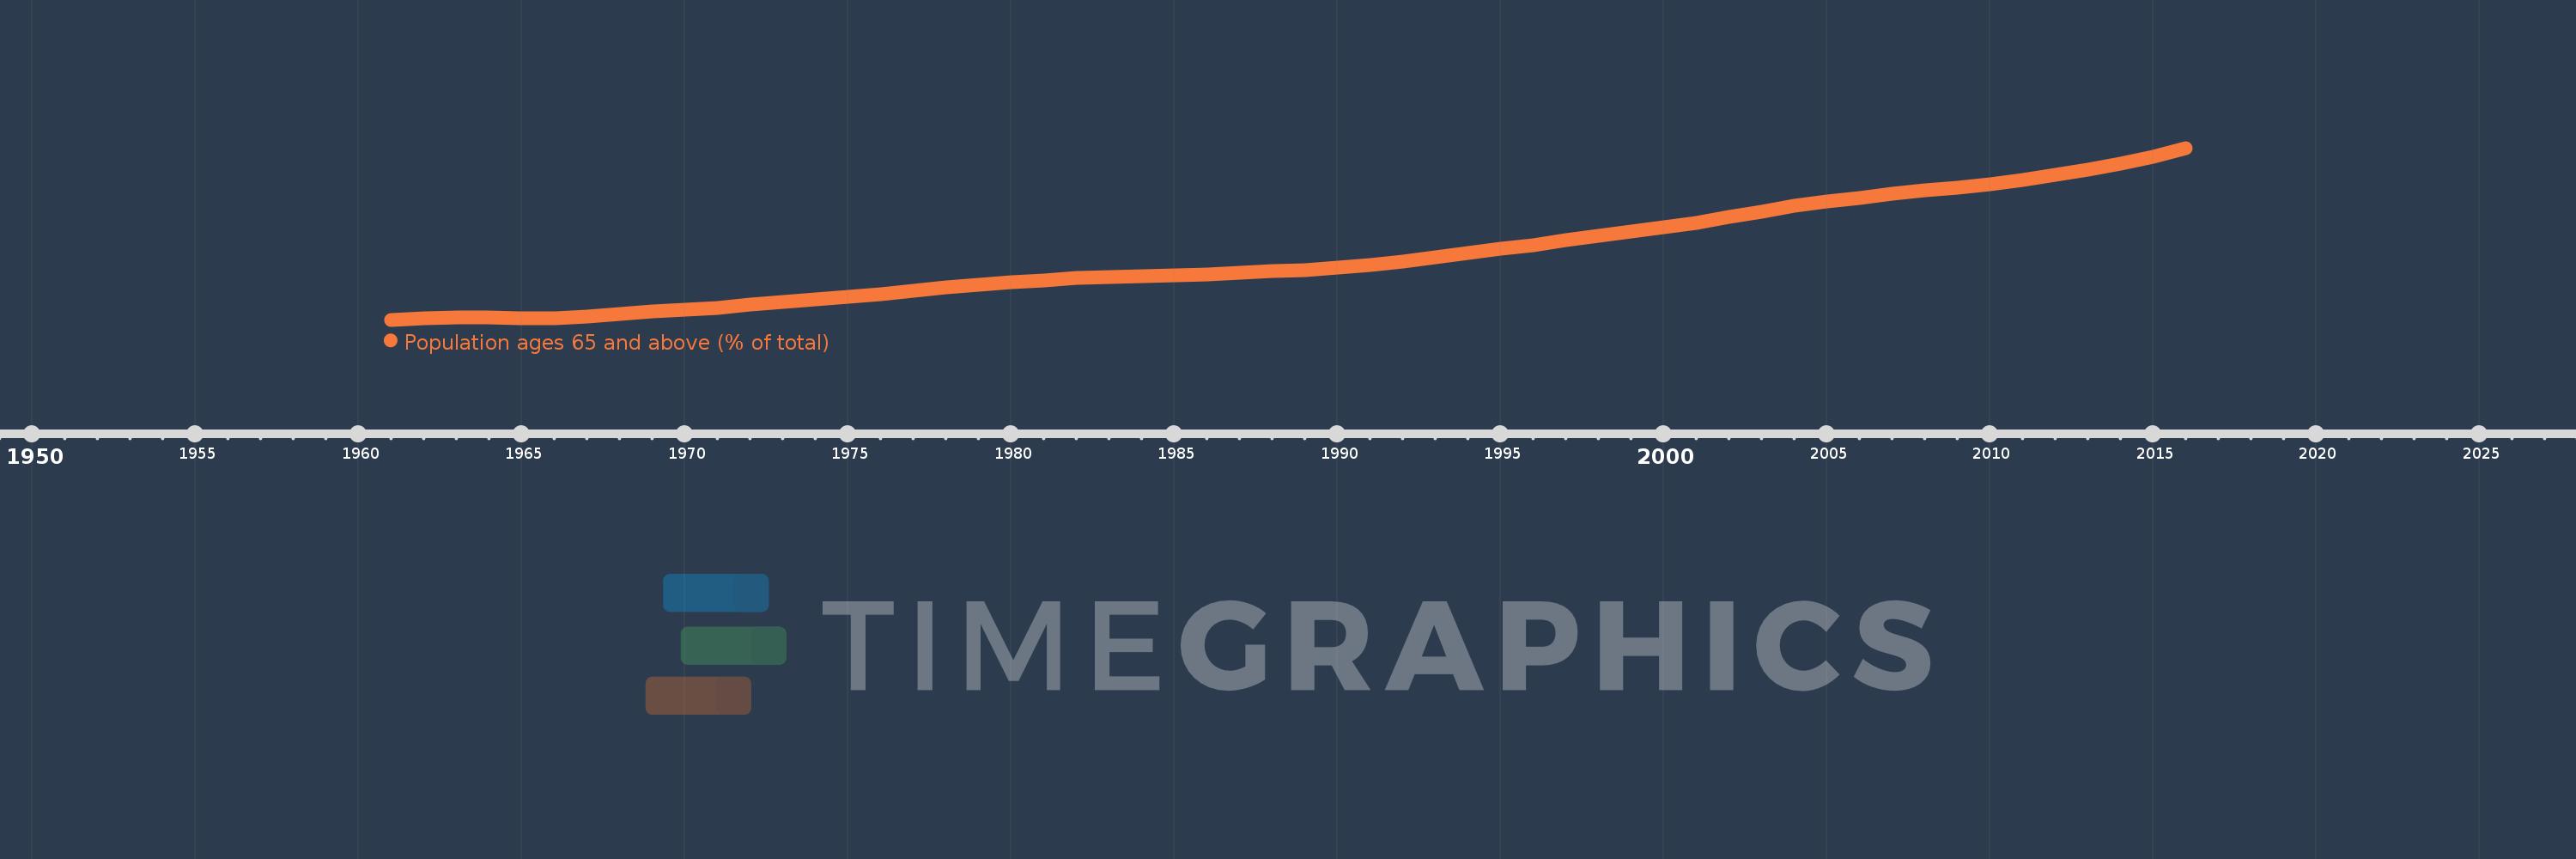
Population ages 65 and above (% of total)
2016,2015,2014,2013,2012,2011,2010,2009,2008,2007,2006,2005,2004,2003,2002,2001,2000,1999,1998,1997,1996,1995,1994,1993,1992,1991,1990,1989,1988,1987,1986,1985,1984,1983,1982,1981,1980,1979,1978,1977,1976,1975,1974,1973,1972,1971,1970,1969,1968,1967,1966,1965,1964,1963,1962,1961
This statistics in other country:
AfghanistanAlbaniaAlgeriaAngolaAntigua and BarbudaArab WorldArgentinaArmeniaArubaAustraliaAustriaAzerbaijanBahamas, TheBahrainBangladeshBarbadosBelarusBelgiumBelizeBeninBhutanBoliviaBosnia and HerzegovinaBotswanaBrazilBrunei DarussalamBulgariaBurkina FasoBurundiCabo VerdeCambodiaCameroonCanadaCaribbean small statesCentral African RepublicCentral Europe and the BalticsChadChannel IslandsChileChinaColombiaComorosCongo, Dem. Rep.Congo, Rep.Costa RicaCote d'IvoireCroatiaCubaCuracaoCyprusCzech RepublicDenmarkDjiboutiDominican RepublicEarly-demographic dividendEast Asia & PacificEast Asia & Pacific (excluding high income)East Asia & Pacific (IDA & IBRD countries)EcuadorEgypt, Arab Rep.El SalvadorEquatorial GuineaEritreaEstoniaEthiopiaEuro areaEurope & Central AsiaEurope & Central Asia (excluding high income)Europe & Central Asia (IDA & IBRD countries)European UnionFijiFinlandFragile and conflict affected situationsFranceFrench PolynesiaGabonGambia, TheGeorgiaGermanyGhanaGreeceGrenadaGuamGuatemalaGuineaGuinea-BissauGuyanaHaitiHeavily indebted poor countries (HIPC)High incomeHondurasHong Kong SAR, ChinaHungaryIBRD onlyIcelandIDA & IBRD totalIDA blendIDA onlyIDA totalIndiaIndonesiaIran, Islamic Rep.IraqIrelandIsraelItalyJamaicaJapanJordanKazakhstanKenyaKiribatiKorea, Dem. People’s Rep.Korea, Rep.KosovoKuwaitKyrgyz RepublicLao PDRLate-demographic dividendLatin America & Caribbean Latin America & Caribbean (excluding high income)Latin America & the Caribbean (IDA & IBRD countries)LatviaLeast developed countries: UN classificationLebanonLesothoLiberiaLibyaLithuaniaLow & middle incomeLow incomeLower middle incomeLuxembourgMacao SAR, ChinaMacedonia, FYRMadagascarMalawiMalaysiaMaldivesMaliMaltaMauritaniaMauritiusMexicoMicronesia, Fed. Sts.Middle East & North AfricaMiddle East & North Africa (excluding high income)Middle East & North Africa (IDA & IBRD countries)Middle incomeMoldovaMongoliaMontenegroMoroccoMozambiqueMyanmarNamibiaNepalNetherlandsNew CaledoniaNew ZealandNicaraguaNigerNigeriaNorth AmericaNorwayOECD membersOmanOther small statesPacific island small statesPakistanPanamaPapua New GuineaParaguayPeruPhilippinesPolandPortugalPost-demographic dividendPre-demographic dividendPuerto RicoQatarRomaniaRussian FederationRwandaSamoaSao Tome and PrincipeSaudi ArabiaSenegalSerbiaSeychellesSierra LeoneSingaporeSlovak RepublicSloveniaSmall statesSolomon IslandsSomaliaSouth AfricaSouth AsiaSouth Asia (IDA & IBRD)South SudanSpainSri LankaSt. LuciaSt. Vincent and the GrenadinesSub-Saharan Africa Sub-Saharan Africa (excluding high income)Sub-Saharan Africa (IDA & IBRD countries)SudanSurinameSwazilandSwedenSwitzerlandSyrian Arab RepublicTajikistanTanzaniaThailandTimor-LesteTogoTongaTrinidad and TobagoTunisiaTurkeyTurkmenistanUgandaUkraineUnited Arab EmiratesUnited KingdomUnited StatesUpper middle incomeUruguayUzbekistanVanuatuVenezuela, RBVietnamVirgin Islands (U.S.)West Bank and GazaWorldYemen, Rep.ZambiaZimbabwe Timeline:
This timeline shows a graph from 1961 to 2016 of IBRD only. No data until 1960. Number of actual observations by date: 56.
Source name:
World Development Indicators
Source organization:
World Bank staff estimates based on age distributions of United Nations Population Division's World Population Prospects.
Categories, topics:
Health
Last updated:
apr 23, 2017
Indicators value changes by year
At the date of observation
Value
Absolute change
Change from previous value
jan 1, 1961
3.867
+3.867
0.0%
jan 1, 1962
3.906
+0.039
1.0%
jan 1, 1963
3.921
+0.015
0.39%
jan 1, 1964
3.919
-0.002
-0.06%
jan 1, 1965
3.908
-0.011
-0.27%
jan 1, 1966
3.892
-0.016
-0.41%
jan 1, 1967
3.946
+0.054
1.39%
jan 1, 1968
3.998
+0.052
1.32%
jan 1, 1969
4.047
+0.048
1.21%
jan 1, 1970
4.09
+0.043
1.07%
jan 1, 1971
4.129
+0.039
0.95%
jan 1, 1972
4.196
+0.067
1.63%
jan 1, 1973
4.258
+0.063
1.49%
jan 1, 1974
4.316
+0.057
1.34%
jan 1, 1975
4.37
+0.054
1.25%
jan 1, 1976
4.422
+0.052
1.2%
jan 1, 1977
4.5
+0.078
1.76%
jan 1, 1978
4.574
+0.074
1.65%
jan 1, 1979
4.641
+0.067
1.46%
jan 1, 1980
4.694
+0.053
1.15%
jan 1, 1981
4.732
+0.038
0.8%
jan 1, 1982
4.78
+0.048
1.02%
jan 1, 1983
4.809
+0.029
0.61%
jan 1, 1984
4.827
+0.018
0.37%
jan 1, 1985
4.842
+0.015
0.31%
jan 1, 1986
4.859
+0.017
0.36%
jan 1, 1987
4.896
+0.037
0.76%
jan 1, 1988
4.93
+0.034
0.69%
jan 1, 1989
4.964
+0.035
0.7%
jan 1, 1990
5.007
+0.042
0.85%
jan 1, 1991
5.06
+0.054
1.07%
jan 1, 1992
5.14
+0.08
1.57%
jan 1, 1993
5.232
+0.092
1.79%
jan 1, 1994
5.329
+0.097
1.86%
jan 1, 1995
5.42
+0.091
1.71%
jan 1, 1996
5.502
+0.082
1.51%
jan 1, 1997
5.617
+0.114
2.08%
jan 1, 1998
5.715
+0.098
1.74%
jan 1, 1999
5.804
+0.089
1.56%
jan 1, 2000
5.896
+0.092
1.59%
jan 1, 2001
5.995
+0.099
1.68%
jan 1, 2002
6.118
+0.123
2.06%
jan 1, 2003
6.243
+0.125
2.05%
jan 1, 2004
6.364
+0.121
1.93%
jan 1, 2005
6.468
+0.104
1.63%
jan 1, 2006
6.55
+0.082
1.27%
jan 1, 2007
6.637
+0.087
1.32%
jan 1, 2008
6.709
+0.073
1.09%
jan 1, 2009
6.777
+0.068
1.01%
jan 1, 2010
6.851
+0.074
1.09%
jan 1, 2011
6.938
+0.087
1.26%
jan 1, 2012
7.048
+0.11
1.58%
jan 1, 2013
7.161
+0.113
1.61%
jan 1, 2014
7.288
+0.127
1.77%
jan 1, 2015
7.445
+0.157
2.16%
jan 1, 2016
7.642
+0.197
2.65%
Ranking of countries by current statistics by years


Comments: