29
/
en
AIzaSyAYiBZKx7MnpbEhh9jyipgxe19OcubqV5w
April 1, 2024
98884
Cambodia
KHM
true
2
1
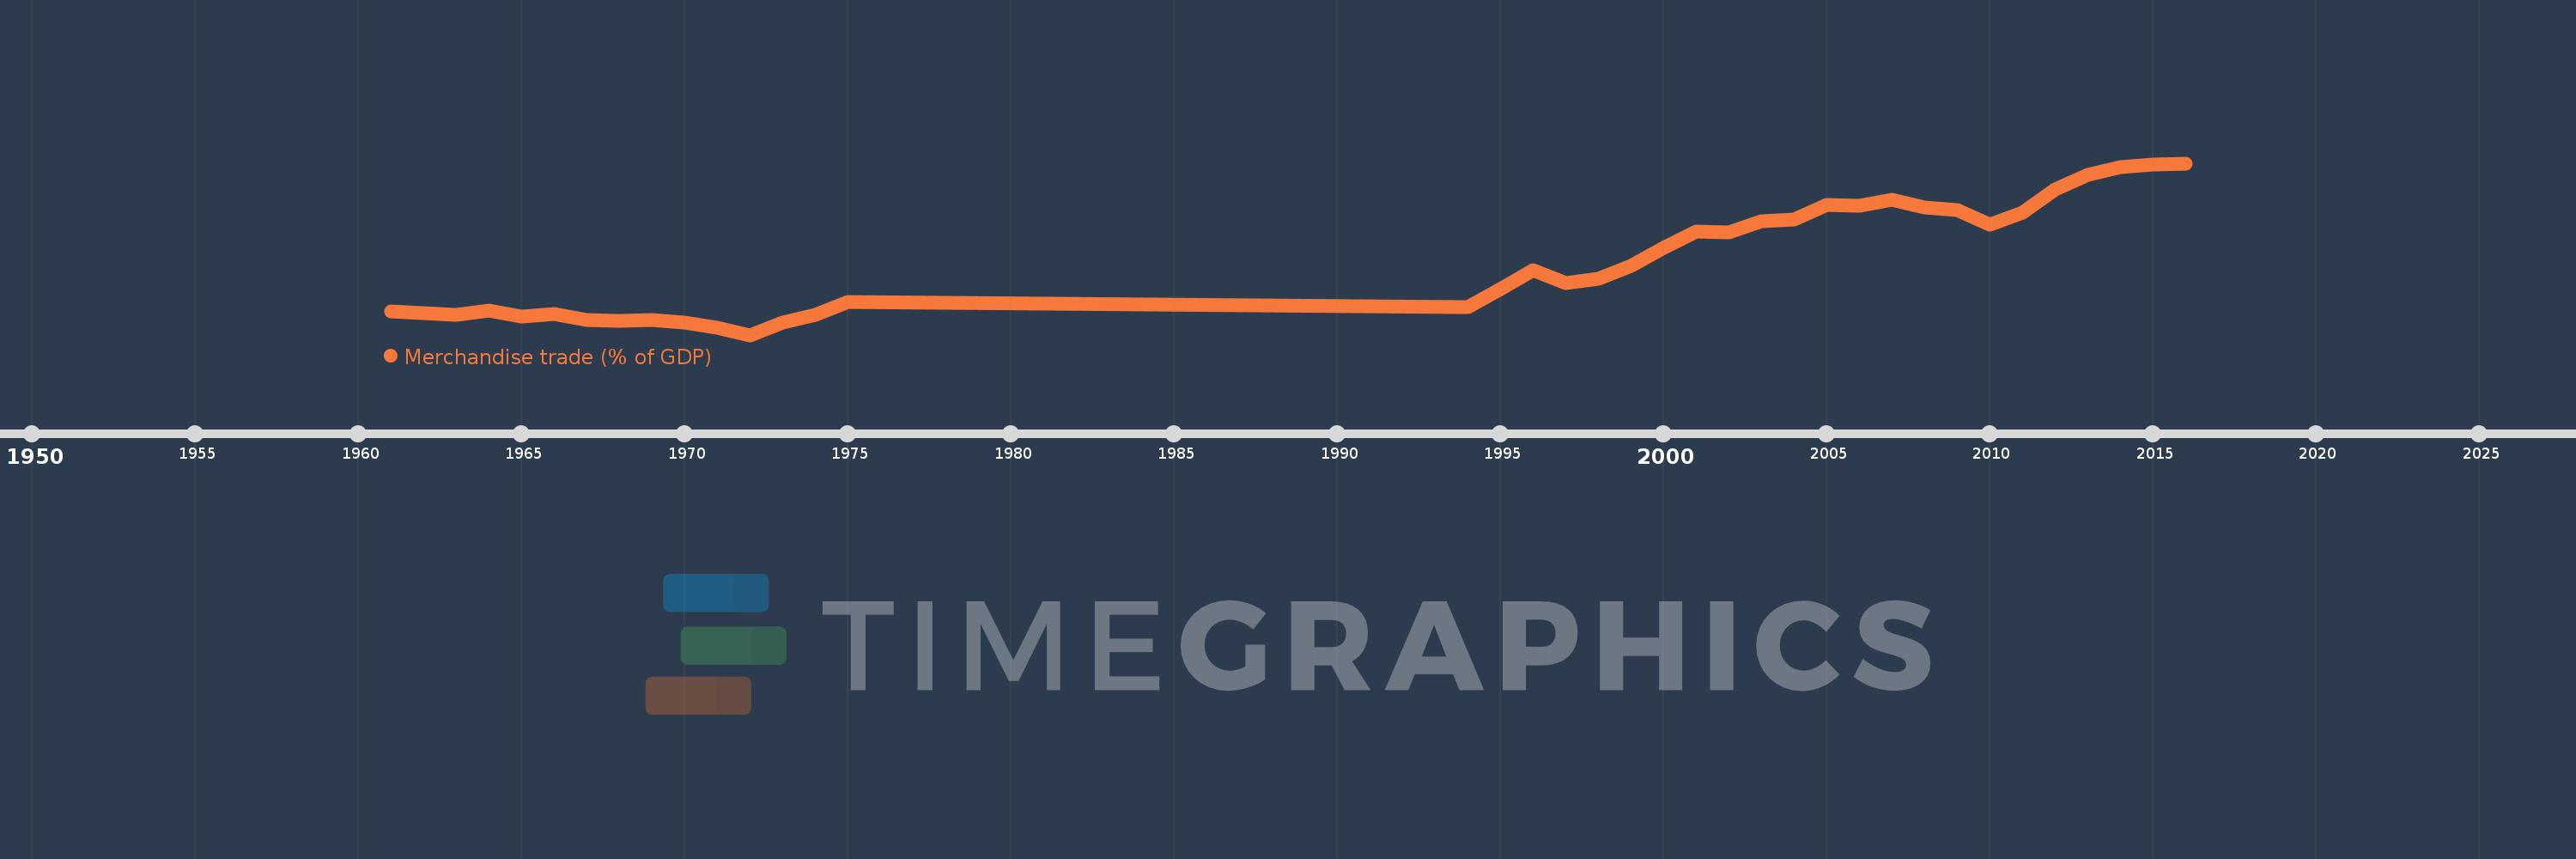
Merchandise trade (% of GDP)
2016,2015,2014,2013,2012,2011,2010,2009,2008,2007,2006,2005,2004,2003,2002,2001,2000,1999,1998,1997,1996,1995,1994,1975,1974,1973,1972,1971,1970,1969,1968,1967,1966,1965,1964,1963,1962,1961
This statistics in other country:
AfghanistanAlbaniaAlgeriaAngolaAntigua and BarbudaArab WorldArgentinaArmeniaArubaAustraliaAustriaAzerbaijanBahamas, TheBahrainBangladeshBarbadosBelarusBelgiumBelizeBeninBermudaBhutanBoliviaBosnia and HerzegovinaBotswanaBrazilBrunei DarussalamBulgariaBurkina FasoBurundiCabo VerdeCambodiaCameroonCanadaCaribbean small statesCentral African RepublicCentral Europe and the BalticsChadChileChinaColombiaComorosCongo, Dem. Rep.Congo, Rep.Costa RicaCote d'IvoireCroatiaCubaCyprusCzech RepublicDenmarkDjiboutiDominicaDominican RepublicEarly-demographic dividendEast Asia & PacificEast Asia & Pacific (excluding high income)East Asia & Pacific (IDA & IBRD countries)EcuadorEgypt, Arab Rep.El SalvadorEquatorial GuineaEritreaEstoniaEthiopiaEuro areaEurope & Central AsiaEurope & Central Asia (excluding high income)Europe & Central Asia (IDA & IBRD countries)European UnionFaroe IslandsFijiFinlandFragile and conflict affected situationsFranceFrench PolynesiaGabonGambia, TheGeorgiaGermanyGhanaGreeceGreenlandGrenadaGuatemalaGuineaGuinea-BissauGuyanaHaitiHeavily indebted poor countries (HIPC)High incomeHondurasHong Kong SAR, ChinaHungaryIBRD onlyIcelandIDA & IBRD totalIDA blendIDA onlyIDA totalIndiaIndonesiaIran, Islamic Rep.IraqIrelandIsraelItalyJamaicaJapanJordanKazakhstanKenyaKiribatiKorea, Rep.KuwaitKyrgyz RepublicLao PDRLate-demographic dividendLatin America & Caribbean Latin America & Caribbean (excluding high income)Latin America & the Caribbean (IDA & IBRD countries)LatviaLeast developed countries: UN classificationLebanonLesothoLiberiaLibyaLithuaniaLow & middle incomeLow incomeLower middle incomeLuxembourgMacao SAR, ChinaMacedonia, FYRMadagascarMalawiMalaysiaMaldivesMaliMaltaMarshall IslandsMauritaniaMauritiusMexicoMicronesia, Fed. Sts.Middle East & North AfricaMiddle East & North Africa (excluding high income)Middle East & North Africa (IDA & IBRD countries)Middle incomeMoldovaMongoliaMontenegroMoroccoMozambiqueMyanmarNamibiaNepalNetherlandsNew CaledoniaNew ZealandNicaraguaNigerNigeriaNorth AmericaNorwayOECD membersOmanOther small statesPacific island small statesPakistanPalauPanamaPapua New GuineaParaguayPeruPhilippinesPolandPortugalPost-demographic dividendPre-demographic dividendQatarRomaniaRussian FederationRwandaSamoaSao Tome and PrincipeSaudi ArabiaSenegalSerbiaSeychellesSierra LeoneSingaporeSlovak RepublicSloveniaSmall statesSolomon IslandsSouth AfricaSouth AsiaSouth Asia (IDA & IBRD)SpainSri LankaSt. Kitts and NevisSt. LuciaSt. Vincent and the GrenadinesSub-Saharan Africa Sub-Saharan Africa (excluding high income)Sub-Saharan Africa (IDA & IBRD countries)SudanSurinameSwazilandSwedenSwitzerlandSyrian Arab RepublicTajikistanTanzaniaThailandTimor-LesteTogoTongaTrinidad and TobagoTunisiaTurkeyTurkmenistanTuvaluUgandaUkraineUnited Arab EmiratesUnited KingdomUnited StatesUpper middle incomeUruguayUzbekistanVanuatuVenezuela, RBVietnamWorldYemen, Rep.ZambiaZimbabwe Timeline:
This timeline shows a graph from 1961 to 2016 of Cambodia. No data until 1960. Number of actual observations by date: 38.
Source name:
World Development Indicators
Source organization:
World Trade Organization, and World Bank GDP estimates.
Categories, topics:
Private Sector, Trade
Last updated:
apr 23, 2017
Indicators value changes by year
Maximum:
146.039
jan 1, 2016
At the date of observation
Value
Absolute change
Change from previous value
jan 1, 1961
25.897
+25.897
0.0%
jan 1, 1962
24.889
-1.008
-3.89%
jan 1, 1963
23.636
-1.253
-5.03%
jan 1, 1964
26.902
+3.266
13.82%
jan 1, 1965
21.715
-5.187
-19.28%
jan 1, 1966
23.947
+2.232
10.28%
jan 1, 1967
19.469
-4.479
-18.7%
jan 1, 1968
18.591
-0.878
-4.51%
jan 1, 1969
19.236
+0.645
3.47%
jan 1, 1970
16.958
-2.278
-11.84%
jan 1, 1971
12.945
-4.013
-23.66%
jan 1, 1972
7.011
-5.934
-45.84%
jan 1, 1973
17.209
+10.198
145.46%
jan 1, 1974
23.474
+6.265
36.41%
jan 1, 1975
33.818
+10.344
44.06%
jan 1, 1994
29.798
-4.02
-11.89%
jan 1, 1995
44.207
+14.409
48.35%
jan 1, 1996
59.34
+15.133
34.23%
jan 1, 1997
48.935
-10.405
-17.53%
jan 1, 1998
52.274
+3.339
6.82%
jan 1, 1999
63.004
+10.731
20.53%
jan 1, 2000
77.333
+14.329
22.74%
jan 1, 2001
91.077
+13.744
17.77%
jan 1, 2002
90.295
-0.783
-0.86%
jan 1, 2003
98.996
+8.701
9.64%
jan 1, 2004
100.423
+1.427
1.44%
jan 1, 2005
112.242
+11.819
11.77%
jan 1, 2006
111.528
-0.714
-0.64%
jan 1, 2007
116.345
+4.817
4.32%
jan 1, 2008
110.28
-6.065
-5.21%
jan 1, 2009
108.351
-1.929
-1.75%
jan 1, 2010
96.393
-11.958
-11.04%
jan 1, 2011
106.152
+9.759
10.12%
jan 1, 2012
124.744
+18.592
17.51%
jan 1, 2013
136.683
+11.939
9.57%
jan 1, 2014
142.71
+6.027
4.41%
jan 1, 2015
145.192
+2.482
1.74%
jan 1, 2016
146.039
+0.847
0.58%
Ranking of countries by current statistics by years


Comments: