29
/
en
AIzaSyAYiBZKx7MnpbEhh9jyipgxe19OcubqV5w
April 1, 2024
35955
High income
HIC
false
2
1
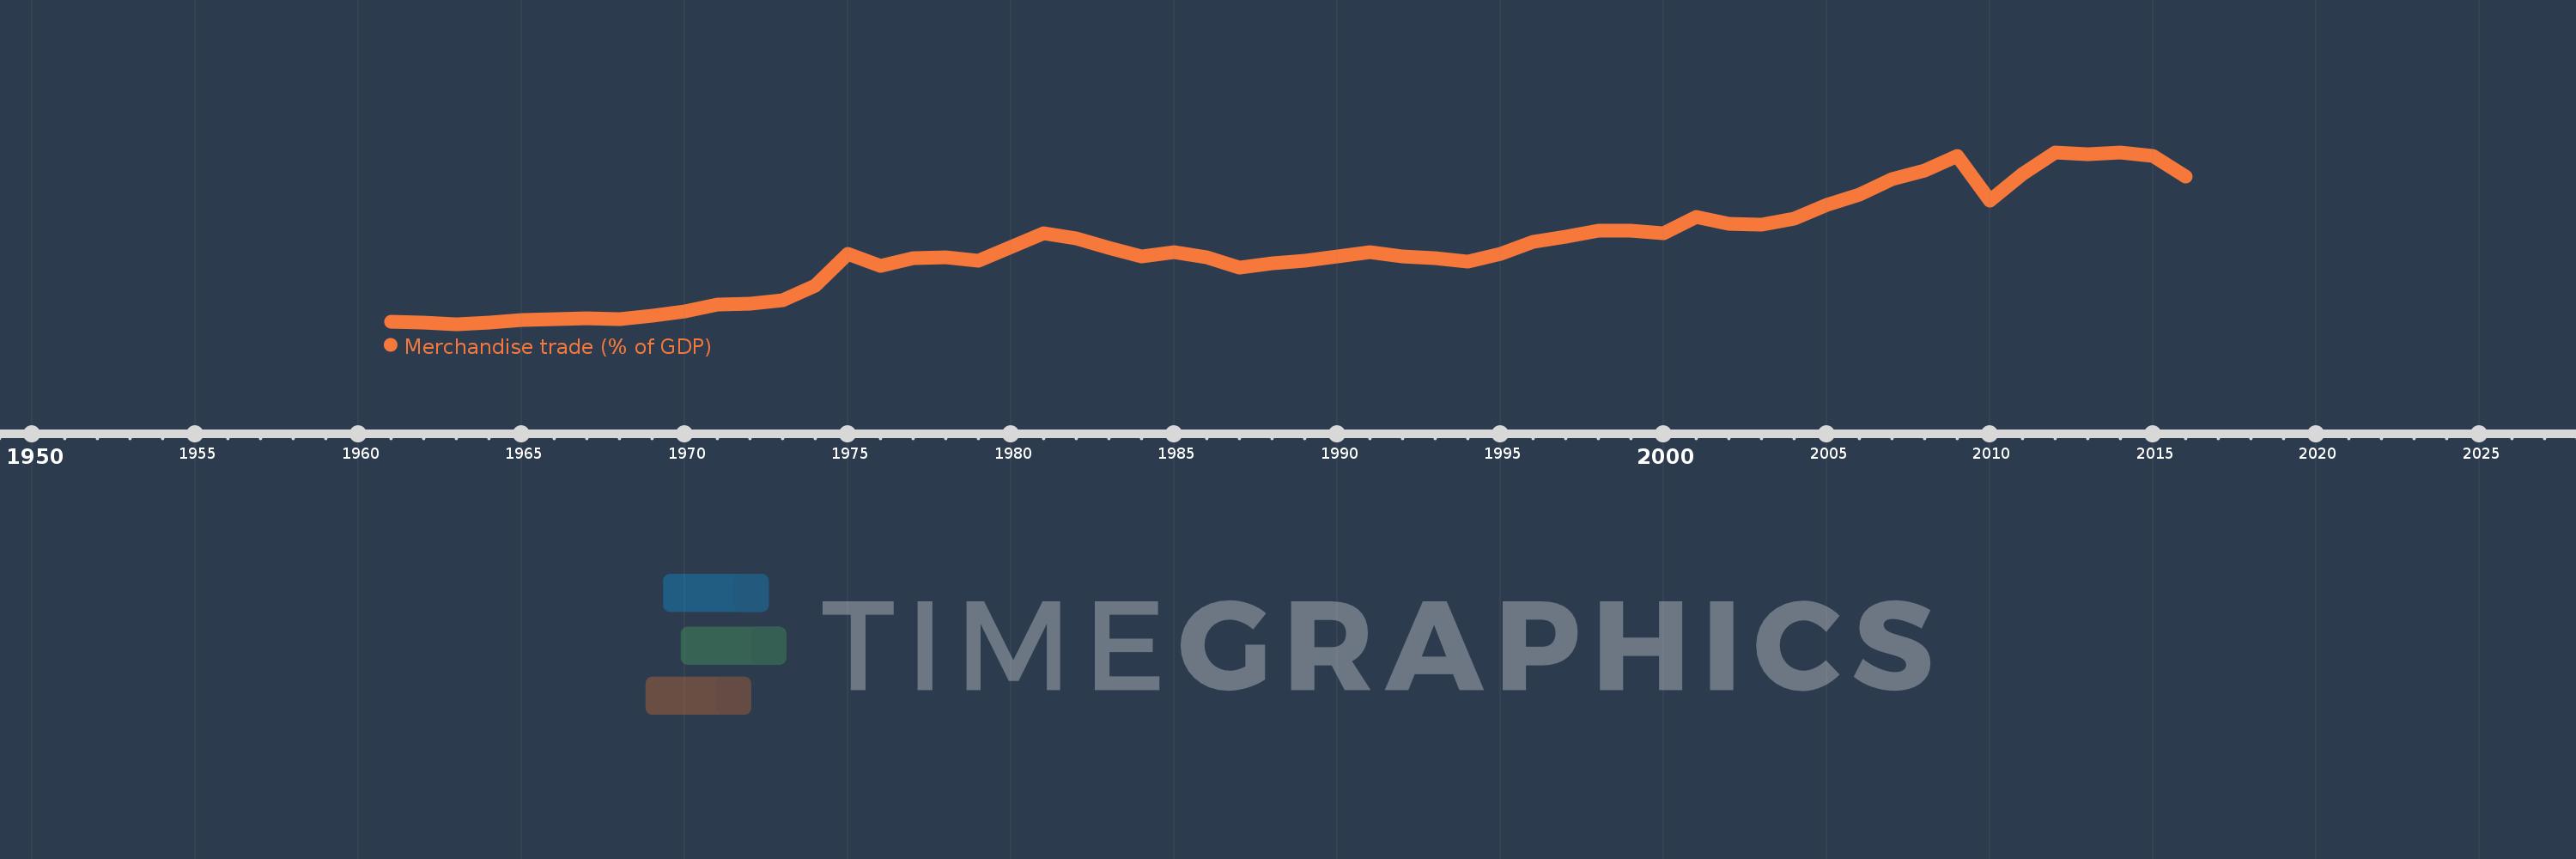
Merchandise trade (% of GDP)
2016,2015,2014,2013,2012,2011,2010,2009,2008,2007,2006,2005,2004,2003,2002,2001,2000,1999,1998,1997,1996,1995,1994,1993,1992,1991,1990,1989,1988,1987,1986,1985,1984,1983,1982,1981,1980,1979,1978,1977,1976,1975,1974,1973,1972,1971,1970,1969,1968,1967,1966,1965,1964,1963,1962,1961
This statistics in other country:
AfghanistanAlbaniaAlgeriaAngolaAntigua and BarbudaArab WorldArgentinaArmeniaArubaAustraliaAustriaAzerbaijanBahamas, TheBahrainBangladeshBarbadosBelarusBelgiumBelizeBeninBermudaBhutanBoliviaBosnia and HerzegovinaBotswanaBrazilBrunei DarussalamBulgariaBurkina FasoBurundiCabo VerdeCambodiaCameroonCanadaCaribbean small statesCentral African RepublicCentral Europe and the BalticsChadChileChinaColombiaComorosCongo, Dem. Rep.Congo, Rep.Costa RicaCote d'IvoireCroatiaCubaCyprusCzech RepublicDenmarkDjiboutiDominicaDominican RepublicEarly-demographic dividendEast Asia & PacificEast Asia & Pacific (excluding high income)East Asia & Pacific (IDA & IBRD countries)EcuadorEgypt, Arab Rep.El SalvadorEquatorial GuineaEritreaEstoniaEthiopiaEuro areaEurope & Central AsiaEurope & Central Asia (excluding high income)Europe & Central Asia (IDA & IBRD countries)European UnionFaroe IslandsFijiFinlandFragile and conflict affected situationsFranceFrench PolynesiaGabonGambia, TheGeorgiaGermanyGhanaGreeceGreenlandGrenadaGuatemalaGuineaGuinea-BissauGuyanaHaitiHeavily indebted poor countries (HIPC)High incomeHondurasHong Kong SAR, ChinaHungaryIBRD onlyIcelandIDA & IBRD totalIDA blendIDA onlyIDA totalIndiaIndonesiaIran, Islamic Rep.IraqIrelandIsraelItalyJamaicaJapanJordanKazakhstanKenyaKiribatiKorea, Rep.KuwaitKyrgyz RepublicLao PDRLate-demographic dividendLatin America & Caribbean Latin America & Caribbean (excluding high income)Latin America & the Caribbean (IDA & IBRD countries)LatviaLeast developed countries: UN classificationLebanonLesothoLiberiaLibyaLithuaniaLow & middle incomeLow incomeLower middle incomeLuxembourgMacao SAR, ChinaMacedonia, FYRMadagascarMalawiMalaysiaMaldivesMaliMaltaMarshall IslandsMauritaniaMauritiusMexicoMicronesia, Fed. Sts.Middle East & North AfricaMiddle East & North Africa (excluding high income)Middle East & North Africa (IDA & IBRD countries)Middle incomeMoldovaMongoliaMontenegroMoroccoMozambiqueMyanmarNamibiaNepalNetherlandsNew CaledoniaNew ZealandNicaraguaNigerNigeriaNorth AmericaNorwayOECD membersOmanOther small statesPacific island small statesPakistanPalauPanamaPapua New GuineaParaguayPeruPhilippinesPolandPortugalPost-demographic dividendPre-demographic dividendQatarRomaniaRussian FederationRwandaSamoaSao Tome and PrincipeSaudi ArabiaSenegalSerbiaSeychellesSierra LeoneSingaporeSlovak RepublicSloveniaSmall statesSolomon IslandsSouth AfricaSouth AsiaSouth Asia (IDA & IBRD)SpainSri LankaSt. Kitts and NevisSt. LuciaSt. Vincent and the GrenadinesSub-Saharan Africa Sub-Saharan Africa (excluding high income)Sub-Saharan Africa (IDA & IBRD countries)SudanSurinameSwazilandSwedenSwitzerlandSyrian Arab RepublicTajikistanTanzaniaThailandTimor-LesteTogoTongaTrinidad and TobagoTunisiaTurkeyTurkmenistanTuvaluUgandaUkraineUnited Arab EmiratesUnited KingdomUnited StatesUpper middle incomeUruguayUzbekistanVanuatuVenezuela, RBVietnamWorldYemen, Rep.ZambiaZimbabwe Timeline:
This timeline shows a graph from 1961 to 2016 of High income. No data until 1960. Number of actual observations by date: 56.
Source name:
World Development Indicators
Source organization:
World Trade Organization, and World Bank GDP estimates.
Categories, topics:
Private Sector, Trade
Last updated:
apr 23, 2017
Indicators value changes by year
Minimum:
16.458
jan 1, 1963
Maximum:
51.622
jan 1, 2014
At the date of observation
Value
Absolute change
Change from previous value
jan 1, 1961
16.915
+16.915
0.0%
jan 1, 1962
16.762
-0.153
-0.9%
jan 1, 1963
16.458
-0.304
-1.81%
jan 1, 1964
16.791
+0.333
2.02%
jan 1, 1965
17.335
+0.544
3.24%
jan 1, 1966
17.47
+0.135
0.78%
jan 1, 1967
17.697
+0.227
1.3%
jan 1, 1968
17.413
-0.285
-1.61%
jan 1, 1969
18.158
+0.745
4.28%
jan 1, 1970
19.019
+0.861
4.74%
jan 1, 1971
20.505
+1.486
7.81%
jan 1, 1972
20.737
+0.232
1.13%
jan 1, 1973
21.296
+0.559
2.7%
jan 1, 1974
24.327
+3.031
14.23%
jan 1, 1975
30.792
+6.465
26.58%
jan 1, 1976
28.436
-2.357
-7.65%
jan 1, 1977
30.013
+1.577
5.55%
jan 1, 1978
30.124
+0.112
0.37%
jan 1, 1979
29.392
-0.732
-2.43%
jan 1, 1980
32.301
+2.909
9.9%
jan 1, 1981
35.146
+2.845
8.81%
jan 1, 1982
33.991
-1.154
-3.28%
jan 1, 1983
32.046
-1.945
-5.72%
jan 1, 1984
30.267
-1.779
-5.55%
jan 1, 1985
31.219
+0.952
3.14%
jan 1, 1986
30.181
-1.038
-3.32%
jan 1, 1987
28.123
-2.058
-6.82%
jan 1, 1988
28.842
+0.72
2.56%
jan 1, 1989
29.42
+0.578
2.0%
jan 1, 1990
30.406
+0.985
3.35%
jan 1, 1991
31.161
+0.756
2.49%
jan 1, 1992
30.262
-0.9
-2.89%
jan 1, 1993
30.038
-0.224
-0.74%
jan 1, 1994
29.203
-0.835
-2.78%
jan 1, 1995
30.912
+1.709
5.85%
jan 1, 1996
33.239
+2.327
7.53%
jan 1, 1997
34.306
+1.067
3.21%
jan 1, 1998
35.685
+1.379
4.02%
jan 1, 1999
35.543
-0.142
-0.4%
jan 1, 2000
35.154
-0.389
-1.09%
jan 1, 2001
38.44
+3.286
9.35%
jan 1, 2002
37.037
-1.403
-3.65%
jan 1, 2003
36.782
-0.255
-0.69%
jan 1, 2004
37.996
+1.214
3.3%
jan 1, 2005
40.832
+2.835
7.46%
jan 1, 2006
42.996
+2.164
5.3%
jan 1, 2007
46.153
+3.158
7.34%
jan 1, 2008
47.926
+1.772
3.84%
jan 1, 2009
50.87
+2.944
6.14%
jan 1, 2010
41.753
-9.117
-17.92%
jan 1, 2011
47.169
+5.416
12.97%
jan 1, 2012
51.541
+4.372
9.27%
jan 1, 2013
51.308
-0.233
-0.45%
jan 1, 2014
51.622
+0.314
0.61%
jan 1, 2015
50.861
-0.761
-1.47%
jan 1, 2016
46.68
-4.182
-8.22%
Ranking of countries by current statistics by years


Comments: