29
/
en
AIzaSyAYiBZKx7MnpbEhh9jyipgxe19OcubqV5w
April 1, 2024
215540
Oman
OMN
true
2
1
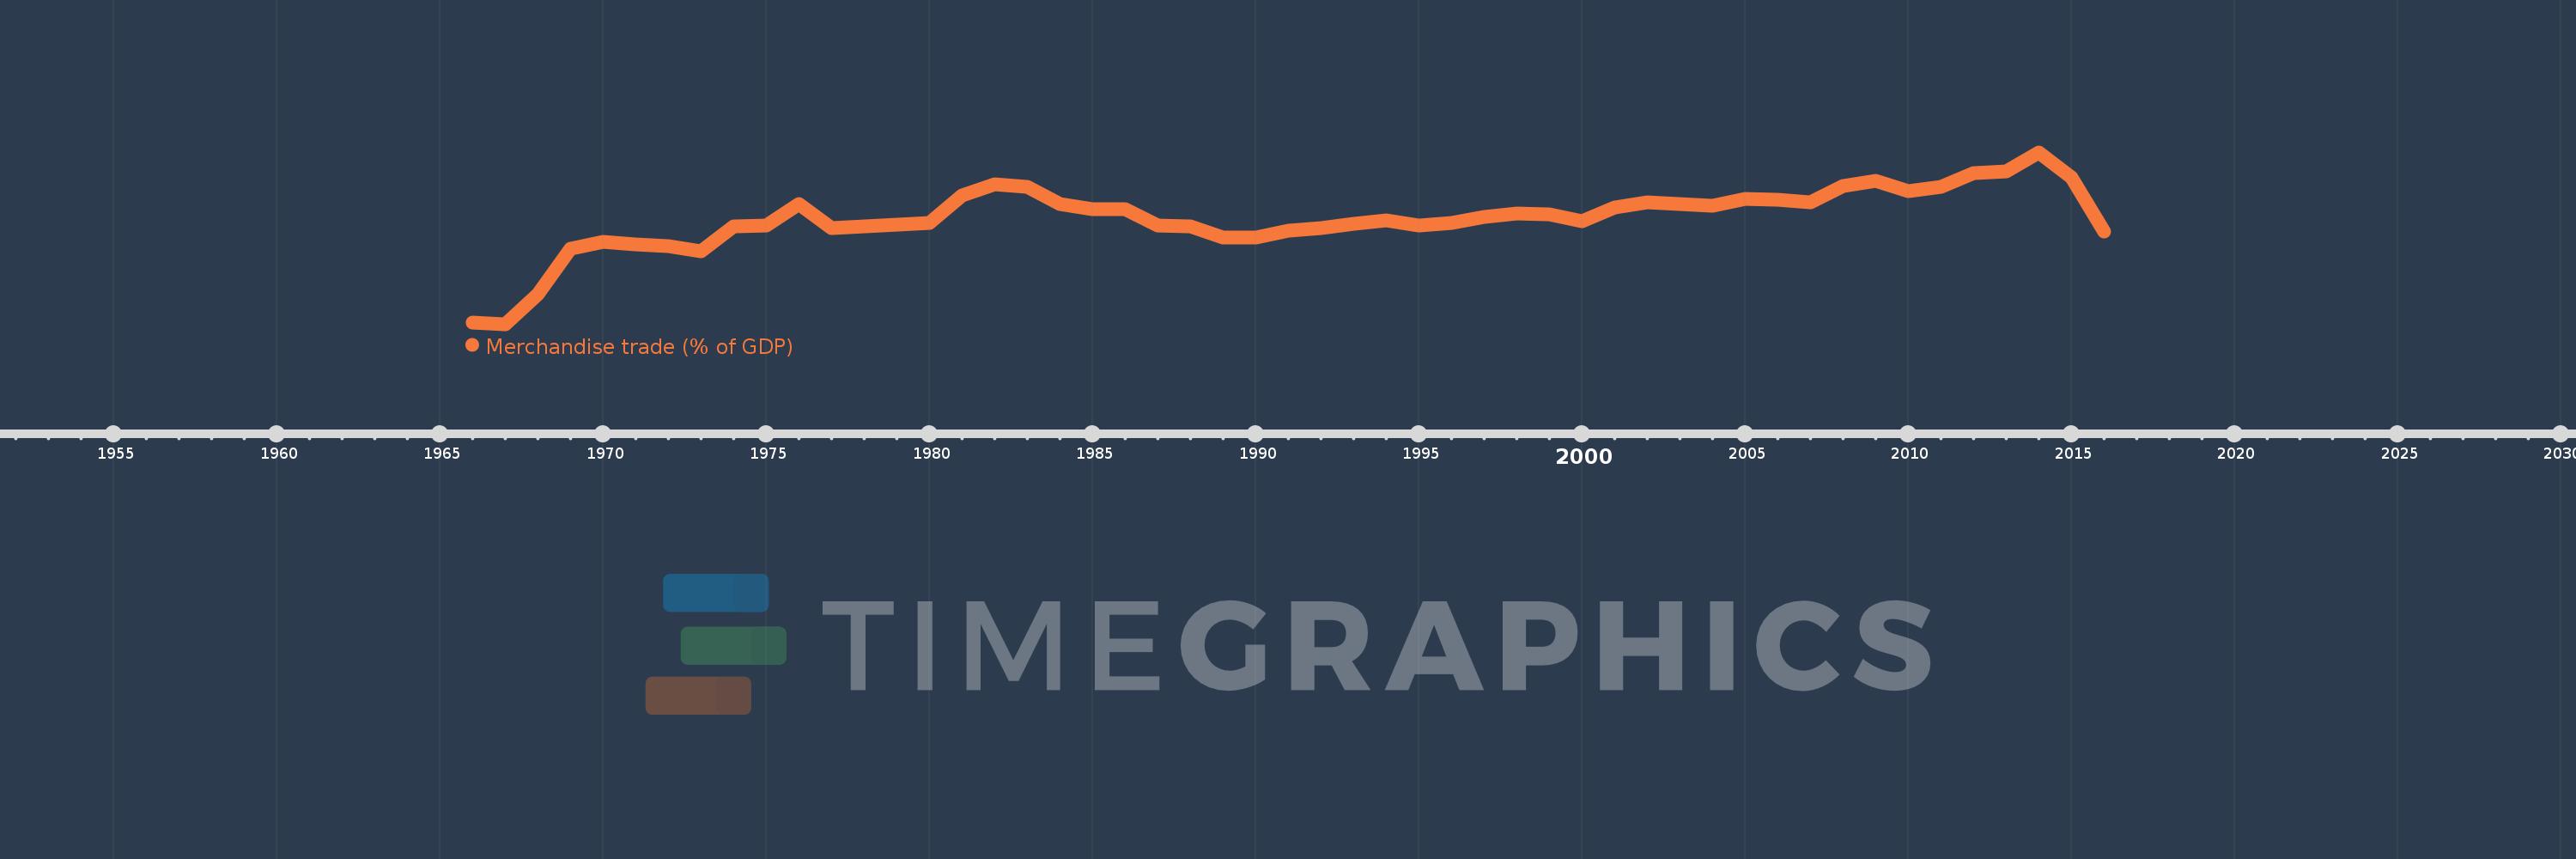
Merchandise trade (% of GDP)
2016,2015,2014,2013,2012,2011,2010,2009,2008,2007,2006,2005,2004,2003,2002,2001,2000,1999,1998,1997,1996,1995,1994,1993,1992,1991,1990,1989,1988,1987,1986,1985,1984,1983,1982,1981,1980,1979,1978,1977,1976,1975,1974,1973,1972,1971,1970,1969,1968,1967,1966
This statistics in other country:
AfghanistanAlbaniaAlgeriaAngolaAntigua and BarbudaArab WorldArgentinaArmeniaArubaAustraliaAustriaAzerbaijanBahamas, TheBahrainBangladeshBarbadosBelarusBelgiumBelizeBeninBermudaBhutanBoliviaBosnia and HerzegovinaBotswanaBrazilBrunei DarussalamBulgariaBurkina FasoBurundiCabo VerdeCambodiaCameroonCanadaCaribbean small statesCentral African RepublicCentral Europe and the BalticsChadChileChinaColombiaComorosCongo, Dem. Rep.Congo, Rep.Costa RicaCote d'IvoireCroatiaCubaCyprusCzech RepublicDenmarkDjiboutiDominicaDominican RepublicEarly-demographic dividendEast Asia & PacificEast Asia & Pacific (excluding high income)East Asia & Pacific (IDA & IBRD countries)EcuadorEgypt, Arab Rep.El SalvadorEquatorial GuineaEritreaEstoniaEthiopiaEuro areaEurope & Central AsiaEurope & Central Asia (excluding high income)Europe & Central Asia (IDA & IBRD countries)European UnionFaroe IslandsFijiFinlandFragile and conflict affected situationsFranceFrench PolynesiaGabonGambia, TheGeorgiaGermanyGhanaGreeceGreenlandGrenadaGuatemalaGuineaGuinea-BissauGuyanaHaitiHeavily indebted poor countries (HIPC)High incomeHondurasHong Kong SAR, ChinaHungaryIBRD onlyIcelandIDA & IBRD totalIDA blendIDA onlyIDA totalIndiaIndonesiaIran, Islamic Rep.IraqIrelandIsraelItalyJamaicaJapanJordanKazakhstanKenyaKiribatiKorea, Rep.KuwaitKyrgyz RepublicLao PDRLate-demographic dividendLatin America & Caribbean Latin America & Caribbean (excluding high income)Latin America & the Caribbean (IDA & IBRD countries)LatviaLeast developed countries: UN classificationLebanonLesothoLiberiaLibyaLithuaniaLow & middle incomeLow incomeLower middle incomeLuxembourgMacao SAR, ChinaMacedonia, FYRMadagascarMalawiMalaysiaMaldivesMaliMaltaMarshall IslandsMauritaniaMauritiusMexicoMicronesia, Fed. Sts.Middle East & North AfricaMiddle East & North Africa (excluding high income)Middle East & North Africa (IDA & IBRD countries)Middle incomeMoldovaMongoliaMontenegroMoroccoMozambiqueMyanmarNamibiaNepalNetherlandsNew CaledoniaNew ZealandNicaraguaNigerNigeriaNorth AmericaNorwayOECD membersOmanOther small statesPacific island small statesPakistanPalauPanamaPapua New GuineaParaguayPeruPhilippinesPolandPortugalPost-demographic dividendPre-demographic dividendQatarRomaniaRussian FederationRwandaSamoaSao Tome and PrincipeSaudi ArabiaSenegalSerbiaSeychellesSierra LeoneSingaporeSlovak RepublicSloveniaSmall statesSolomon IslandsSouth AfricaSouth AsiaSouth Asia (IDA & IBRD)SpainSri LankaSt. Kitts and NevisSt. LuciaSt. Vincent and the GrenadinesSub-Saharan Africa Sub-Saharan Africa (excluding high income)Sub-Saharan Africa (IDA & IBRD countries)SudanSurinameSwazilandSwedenSwitzerlandSyrian Arab RepublicTajikistanTanzaniaThailandTimor-LesteTogoTongaTrinidad and TobagoTunisiaTurkeyTurkmenistanTuvaluUgandaUkraineUnited Arab EmiratesUnited KingdomUnited StatesUpper middle incomeUruguayUzbekistanVanuatuVenezuela, RBVietnamWorldYemen, Rep.ZambiaZimbabwe Timeline:
This timeline shows a graph from 1966 to 2016 of Oman. No data until 1965. Number of actual observations by date: 51.
Source name:
World Development Indicators
Source organization:
World Trade Organization, and World Bank GDP estimates.
Categories, topics:
Private Sector, Trade
Last updated:
apr 23, 2017
Indicators value changes by year
Minimum:
16.527
jan 1, 1967
Maximum:
116.553
jan 1, 2014
At the date of observation
Value
Absolute change
Change from previous value
jan 1, 1966
17.697
+17.697
0.0%
jan 1, 1967
16.527
-1.17
-6.61%
jan 1, 1968
33.734
+17.207
104.12%
jan 1, 1969
60.452
+26.718
79.2%
jan 1, 1970
64.359
+3.907
6.46%
jan 1, 1971
62.802
-1.557
-2.42%
jan 1, 1972
62.054
-0.748
-1.19%
jan 1, 1973
58.891
-3.163
-5.1%
jan 1, 1974
73.414
+14.523
24.66%
jan 1, 1975
73.841
+0.427
0.58%
jan 1, 1976
86.289
+12.448
16.86%
jan 1, 1977
72.606
-13.683
-15.86%
jan 1, 1978
73.453
+0.846
1.17%
jan 1, 1979
74.581
+1.128
1.54%
jan 1, 1980
75.437
+0.856
1.15%
jan 1, 1981
91.612
+16.175
21.44%
jan 1, 1982
97.932
+6.32
6.9%
jan 1, 1983
96.483
-1.449
-1.48%
jan 1, 1984
86.618
-9.865
-10.22%
jan 1, 1985
83.377
-3.241
-3.74%
jan 1, 1986
83.314
-0.063
-0.08%
jan 1, 1987
73.828
-9.487
-11.39%
jan 1, 1988
73.497
-0.33
-0.45%
jan 1, 1989
66.895
-6.602
-8.98%
jan 1, 1990
67.188
+0.293
0.44%
jan 1, 1991
71.082
+3.894
5.8%
jan 1, 1992
72.283
+1.201
1.69%
jan 1, 1993
74.926
+2.643
3.66%
jan 1, 1994
76.802
+1.876
2.5%
jan 1, 1995
73.993
-2.81
-3.66%
jan 1, 1996
75.689
+1.696
2.29%
jan 1, 1997
79.03
+3.341
4.41%
jan 1, 1998
80.954
+1.924
2.43%
jan 1, 1999
80.466
-0.487
-0.6%
jan 1, 2000
76.632
-3.834
-4.77%
jan 1, 2001
84.327
+7.695
10.04%
jan 1, 2002
87.431
+3.104
3.68%
jan 1, 2003
86.722
-0.709
-0.81%
jan 1, 2004
85.374
-1.347
-1.55%
jan 1, 2005
89.394
+4.019
4.71%
jan 1, 2006
88.999
-0.394
-0.44%
jan 1, 2007
87.661
-1.338
-1.5%
jan 1, 2008
96.748
+9.087
10.37%
jan 1, 2009
99.92
+3.171
3.28%
jan 1, 2010
94.212
-5.708
-5.71%
jan 1, 2011
96.475
+2.263
2.4%
jan 1, 2012
104.67
+8.196
8.5%
jan 1, 2013
105.326
+0.656
0.63%
jan 1, 2014
116.553
+11.227
10.66%
jan 1, 2015
101.839
-14.714
-12.62%
jan 1, 2016
70.663
-31.177
-30.61%
Ranking of countries by current statistics by years


Comments: