29
/
en
AIzaSyAYiBZKx7MnpbEhh9jyipgxe19OcubqV5w
April 1, 2024
40112
IDA total
IDA
false
2
1
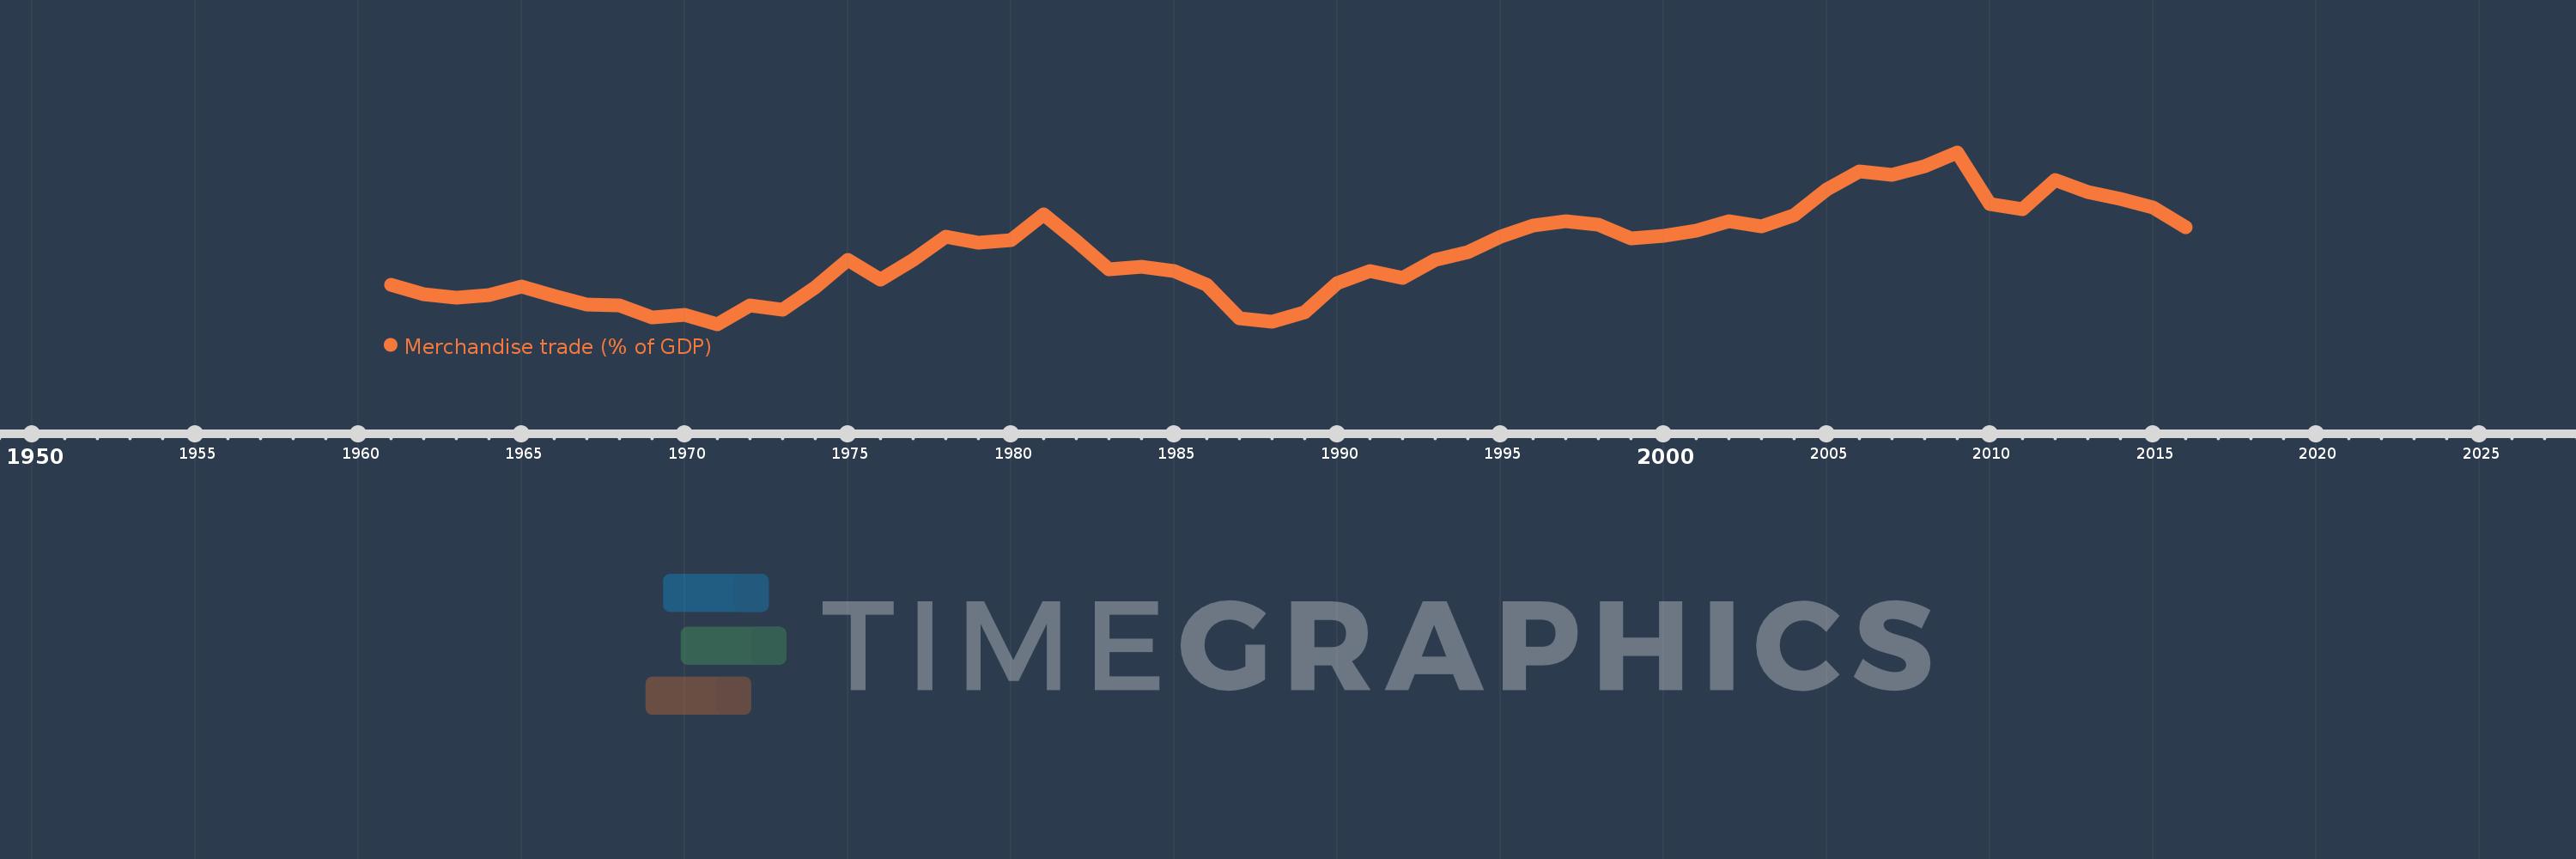
Merchandise trade (% of GDP)
2016,2015,2014,2013,2012,2011,2010,2009,2008,2007,2006,2005,2004,2003,2002,2001,2000,1999,1998,1997,1996,1995,1994,1993,1992,1991,1990,1989,1988,1987,1986,1985,1984,1983,1982,1981,1980,1979,1978,1977,1976,1975,1974,1973,1972,1971,1970,1969,1968,1967,1966,1965,1964,1963,1962,1961
This statistics in other country:
AfghanistanAlbaniaAlgeriaAngolaAntigua and BarbudaArab WorldArgentinaArmeniaArubaAustraliaAustriaAzerbaijanBahamas, TheBahrainBangladeshBarbadosBelarusBelgiumBelizeBeninBermudaBhutanBoliviaBosnia and HerzegovinaBotswanaBrazilBrunei DarussalamBulgariaBurkina FasoBurundiCabo VerdeCambodiaCameroonCanadaCaribbean small statesCentral African RepublicCentral Europe and the BalticsChadChileChinaColombiaComorosCongo, Dem. Rep.Congo, Rep.Costa RicaCote d'IvoireCroatiaCubaCyprusCzech RepublicDenmarkDjiboutiDominicaDominican RepublicEarly-demographic dividendEast Asia & PacificEast Asia & Pacific (excluding high income)East Asia & Pacific (IDA & IBRD countries)EcuadorEgypt, Arab Rep.El SalvadorEquatorial GuineaEritreaEstoniaEthiopiaEuro areaEurope & Central AsiaEurope & Central Asia (excluding high income)Europe & Central Asia (IDA & IBRD countries)European UnionFaroe IslandsFijiFinlandFragile and conflict affected situationsFranceFrench PolynesiaGabonGambia, TheGeorgiaGermanyGhanaGreeceGreenlandGrenadaGuatemalaGuineaGuinea-BissauGuyanaHaitiHeavily indebted poor countries (HIPC)High incomeHondurasHong Kong SAR, ChinaHungaryIBRD onlyIcelandIDA & IBRD totalIDA blendIDA onlyIDA totalIndiaIndonesiaIran, Islamic Rep.IraqIrelandIsraelItalyJamaicaJapanJordanKazakhstanKenyaKiribatiKorea, Rep.KuwaitKyrgyz RepublicLao PDRLate-demographic dividendLatin America & Caribbean Latin America & Caribbean (excluding high income)Latin America & the Caribbean (IDA & IBRD countries)LatviaLeast developed countries: UN classificationLebanonLesothoLiberiaLibyaLithuaniaLow & middle incomeLow incomeLower middle incomeLuxembourgMacao SAR, ChinaMacedonia, FYRMadagascarMalawiMalaysiaMaldivesMaliMaltaMarshall IslandsMauritaniaMauritiusMexicoMicronesia, Fed. Sts.Middle East & North AfricaMiddle East & North Africa (excluding high income)Middle East & North Africa (IDA & IBRD countries)Middle incomeMoldovaMongoliaMontenegroMoroccoMozambiqueMyanmarNamibiaNepalNetherlandsNew CaledoniaNew ZealandNicaraguaNigerNigeriaNorth AmericaNorwayOECD membersOmanOther small statesPacific island small statesPakistanPalauPanamaPapua New GuineaParaguayPeruPhilippinesPolandPortugalPost-demographic dividendPre-demographic dividendQatarRomaniaRussian FederationRwandaSamoaSao Tome and PrincipeSaudi ArabiaSenegalSerbiaSeychellesSierra LeoneSingaporeSlovak RepublicSloveniaSmall statesSolomon IslandsSouth AfricaSouth AsiaSouth Asia (IDA & IBRD)SpainSri LankaSt. Kitts and NevisSt. LuciaSt. Vincent and the GrenadinesSub-Saharan Africa Sub-Saharan Africa (excluding high income)Sub-Saharan Africa (IDA & IBRD countries)SudanSurinameSwazilandSwedenSwitzerlandSyrian Arab RepublicTajikistanTanzaniaThailandTimor-LesteTogoTongaTrinidad and TobagoTunisiaTurkeyTurkmenistanTuvaluUgandaUkraineUnited Arab EmiratesUnited KingdomUnited StatesUpper middle incomeUruguayUzbekistanVanuatuVenezuela, RBVietnamWorldYemen, Rep.ZambiaZimbabwe Timeline:
This timeline shows a graph from 1961 to 2016 of IDA total. No data until 1960. Number of actual observations by date: 56.
Source name:
World Development Indicators
Source organization:
World Trade Organization, and World Bank GDP estimates.
Categories, topics:
Private Sector, Trade
Last updated:
apr 23, 2017
Indicators value changes by year
Minimum:
28.737
jan 1, 1971
Maximum:
62.141
jan 1, 2009
At the date of observation
Value
Absolute change
Change from previous value
jan 1, 1961
36.465
+36.465
0.0%
jan 1, 1962
34.532
-1.933
-5.3%
jan 1, 1963
33.929
-0.603
-1.75%
jan 1, 1964
34.381
+0.452
1.33%
jan 1, 1965
36.082
+1.702
4.95%
jan 1, 1966
34.293
-1.789
-4.96%
jan 1, 1967
32.559
-1.734
-5.06%
jan 1, 1968
32.312
-0.247
-0.76%
jan 1, 1969
30.027
-2.284
-7.07%
jan 1, 1970
30.513
+0.485
1.62%
jan 1, 1971
28.737
-1.775
-5.82%
jan 1, 1972
32.34
+3.603
12.54%
jan 1, 1973
31.608
-0.733
-2.27%
jan 1, 1974
35.886
+4.278
13.54%
jan 1, 1975
41.279
+5.393
15.03%
jan 1, 1976
37.395
-3.883
-9.41%
jan 1, 1977
41.311
+3.915
10.47%
jan 1, 1978
45.753
+4.442
10.75%
jan 1, 1979
44.565
-1.188
-2.6%
jan 1, 1980
45.058
+0.492
1.11%
jan 1, 1981
50.065
+5.007
11.11%
jan 1, 1982
44.882
-5.183
-10.35%
jan 1, 1983
39.332
-5.55
-12.37%
jan 1, 1984
39.866
+0.534
1.36%
jan 1, 1985
39.155
-0.711
-1.78%
jan 1, 1986
36.486
-2.669
-6.82%
jan 1, 1987
29.943
-6.542
-17.93%
jan 1, 1988
29.244
-0.699
-2.34%
jan 1, 1989
31.073
+1.829
6.26%
jan 1, 1990
36.658
+5.585
17.97%
jan 1, 1991
39.1
+2.442
6.66%
jan 1, 1992
37.754
-1.347
-3.44%
jan 1, 1993
41.18
+3.426
9.07%
jan 1, 1994
42.753
+1.573
3.82%
jan 1, 1995
45.804
+3.052
7.14%
jan 1, 1996
47.997
+2.192
4.79%
jan 1, 1997
48.753
+0.756
1.58%
jan 1, 1998
48.1
-0.653
-1.34%
jan 1, 1999
45.378
-2.722
-5.66%
jan 1, 2000
45.996
+0.617
1.36%
jan 1, 2001
46.899
+0.903
1.96%
jan 1, 2002
48.762
+1.863
3.97%
jan 1, 2003
47.723
-1.039
-2.13%
jan 1, 2004
49.884
+2.161
4.53%
jan 1, 2005
55.023
+5.14
10.3%
jan 1, 2006
58.393
+3.37
6.12%
jan 1, 2007
57.855
-0.539
-0.92%
jan 1, 2008
59.455
+1.601
2.77%
jan 1, 2009
62.141
+2.686
4.52%
jan 1, 2010
52.042
-10.099
-16.25%
jan 1, 2011
51.125
-0.917
-1.76%
jan 1, 2012
56.831
+5.706
11.16%
jan 1, 2013
54.393
-2.438
-4.29%
jan 1, 2014
53.151
-1.242
-2.28%
jan 1, 2015
51.438
-1.713
-3.22%
jan 1, 2016
47.517
-3.921
-7.62%
Ranking of countries by current statistics by years


Comments: