29
/
en
AIzaSyAYiBZKx7MnpbEhh9jyipgxe19OcubqV5w
April 1, 2024
286183
Zambia
ZMB
true
2
1
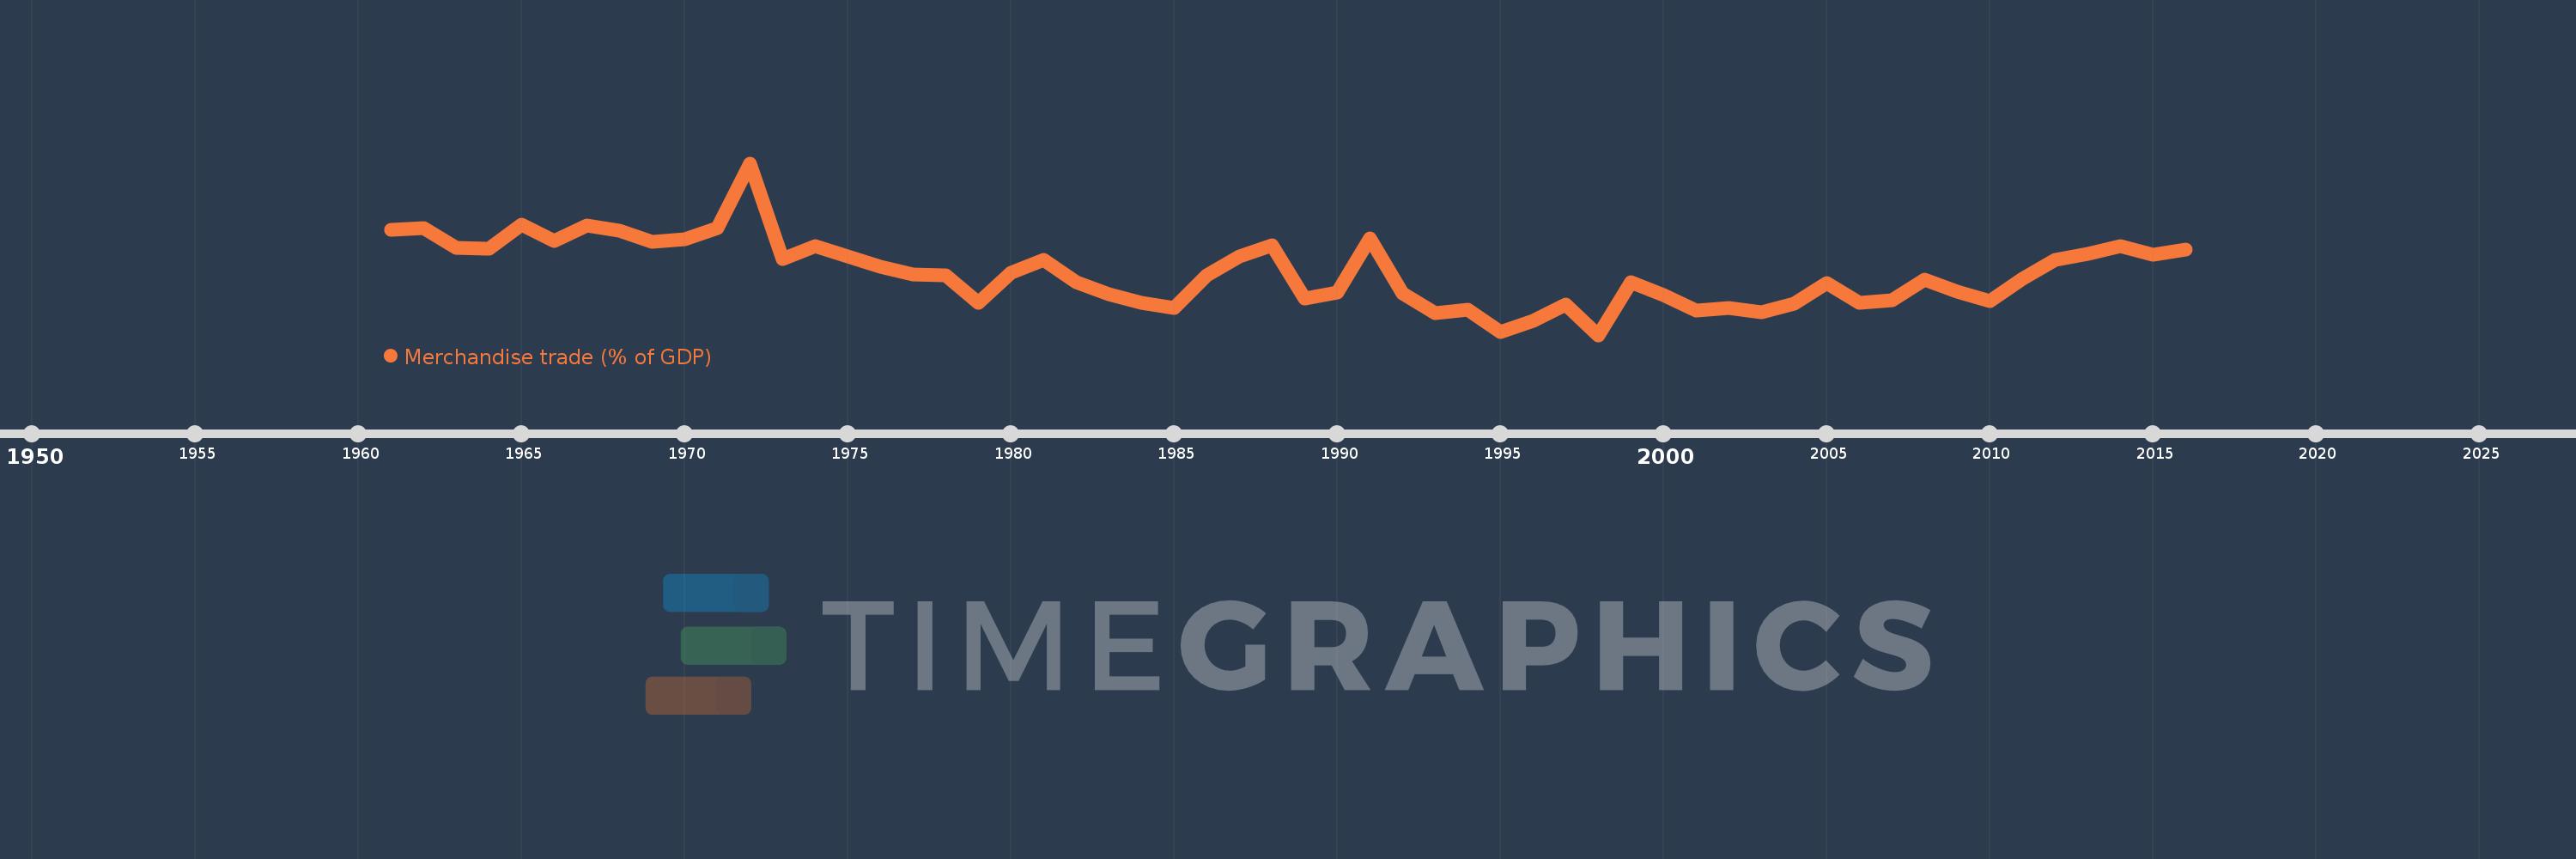
Merchandise trade (% of GDP)
2016,2015,2014,2013,2012,2011,2010,2009,2008,2007,2006,2005,2004,2003,2002,2001,2000,1999,1998,1997,1996,1995,1994,1993,1992,1991,1990,1989,1988,1987,1986,1985,1984,1983,1982,1981,1980,1979,1978,1977,1976,1975,1974,1973,1972,1971,1970,1969,1968,1967,1966,1965,1964,1963,1962,1961
This statistics in other country:
AfghanistanAlbaniaAlgeriaAngolaAntigua and BarbudaArab WorldArgentinaArmeniaArubaAustraliaAustriaAzerbaijanBahamas, TheBahrainBangladeshBarbadosBelarusBelgiumBelizeBeninBermudaBhutanBoliviaBosnia and HerzegovinaBotswanaBrazilBrunei DarussalamBulgariaBurkina FasoBurundiCabo VerdeCambodiaCameroonCanadaCaribbean small statesCentral African RepublicCentral Europe and the BalticsChadChileChinaColombiaComorosCongo, Dem. Rep.Congo, Rep.Costa RicaCote d'IvoireCroatiaCubaCyprusCzech RepublicDenmarkDjiboutiDominicaDominican RepublicEarly-demographic dividendEast Asia & PacificEast Asia & Pacific (excluding high income)East Asia & Pacific (IDA & IBRD countries)EcuadorEgypt, Arab Rep.El SalvadorEquatorial GuineaEritreaEstoniaEthiopiaEuro areaEurope & Central AsiaEurope & Central Asia (excluding high income)Europe & Central Asia (IDA & IBRD countries)European UnionFaroe IslandsFijiFinlandFragile and conflict affected situationsFranceFrench PolynesiaGabonGambia, TheGeorgiaGermanyGhanaGreeceGreenlandGrenadaGuatemalaGuineaGuinea-BissauGuyanaHaitiHeavily indebted poor countries (HIPC)High incomeHondurasHong Kong SAR, ChinaHungaryIBRD onlyIcelandIDA & IBRD totalIDA blendIDA onlyIDA totalIndiaIndonesiaIran, Islamic Rep.IraqIrelandIsraelItalyJamaicaJapanJordanKazakhstanKenyaKiribatiKorea, Rep.KuwaitKyrgyz RepublicLao PDRLate-demographic dividendLatin America & Caribbean Latin America & Caribbean (excluding high income)Latin America & the Caribbean (IDA & IBRD countries)LatviaLeast developed countries: UN classificationLebanonLesothoLiberiaLibyaLithuaniaLow & middle incomeLow incomeLower middle incomeLuxembourgMacao SAR, ChinaMacedonia, FYRMadagascarMalawiMalaysiaMaldivesMaliMaltaMarshall IslandsMauritaniaMauritiusMexicoMicronesia, Fed. Sts.Middle East & North AfricaMiddle East & North Africa (excluding high income)Middle East & North Africa (IDA & IBRD countries)Middle incomeMoldovaMongoliaMontenegroMoroccoMozambiqueMyanmarNamibiaNepalNetherlandsNew CaledoniaNew ZealandNicaraguaNigerNigeriaNorth AmericaNorwayOECD membersOmanOther small statesPacific island small statesPakistanPalauPanamaPapua New GuineaParaguayPeruPhilippinesPolandPortugalPost-demographic dividendPre-demographic dividendQatarRomaniaRussian FederationRwandaSamoaSao Tome and PrincipeSaudi ArabiaSenegalSerbiaSeychellesSierra LeoneSingaporeSlovak RepublicSloveniaSmall statesSolomon IslandsSouth AfricaSouth AsiaSouth Asia (IDA & IBRD)SpainSri LankaSt. Kitts and NevisSt. LuciaSt. Vincent and the GrenadinesSub-Saharan Africa Sub-Saharan Africa (excluding high income)Sub-Saharan Africa (IDA & IBRD countries)SudanSurinameSwazilandSwedenSwitzerlandSyrian Arab RepublicTajikistanTanzaniaThailandTimor-LesteTogoTongaTrinidad and TobagoTunisiaTurkeyTurkmenistanTuvaluUgandaUkraineUnited Arab EmiratesUnited KingdomUnited StatesUpper middle incomeUruguayUzbekistanVanuatuVenezuela, RBVietnamWorldYemen, Rep.ZambiaZimbabwe Timeline:
This timeline shows a graph from 1961 to 2016 of Zambia. No data until 1960. Number of actual observations by date: 56.
Source name:
World Development Indicators
Source organization:
World Trade Organization, and World Bank GDP estimates.
Categories, topics:
Private Sector, Trade
Last updated:
apr 23, 2017
Indicators value changes by year
Minimum:
40.295
jan 1, 1998
Maximum:
105.614
jan 1, 1972
At the date of observation
Value
Absolute change
Change from previous value
jan 1, 1961
80.224
+80.224
0.0%
jan 1, 1962
80.858
+0.633
0.79%
jan 1, 1963
73.578
-7.28
-9.0%
jan 1, 1964
73.047
-0.531
-0.72%
jan 1, 1965
82.123
+9.075
12.42%
jan 1, 1966
76.219
-5.904
-7.19%
jan 1, 1967
81.914
+5.695
7.47%
jan 1, 1968
79.957
-1.957
-2.39%
jan 1, 1969
75.727
-4.23
-5.29%
jan 1, 1970
76.785
+1.058
1.4%
jan 1, 1971
80.984
+4.199
5.47%
jan 1, 1972
105.614
+24.63
30.41%
jan 1, 1973
69.279
-36.335
-34.4%
jan 1, 1974
73.935
+4.656
6.72%
jan 1, 1975
70.278
-3.657
-4.95%
jan 1, 1976
66.419
-3.859
-5.49%
jan 1, 1977
63.475
-2.945
-4.43%
jan 1, 1978
63.123
-0.352
-0.55%
jan 1, 1979
52.384
-10.739
-17.01%
jan 1, 1980
63.817
+11.433
21.83%
jan 1, 1981
68.86
+5.043
7.9%
jan 1, 1982
60.423
-8.437
-12.25%
jan 1, 1983
55.698
-4.726
-7.82%
jan 1, 1984
52.451
-3.246
-5.83%
jan 1, 1985
50.448
-2.003
-3.82%
jan 1, 1986
63.035
+12.587
24.95%
jan 1, 1987
70.098
+7.063
11.2%
jan 1, 1988
74.409
+4.31
6.15%
jan 1, 1989
54.233
-20.176
-27.11%
jan 1, 1990
56.344
+2.111
3.89%
jan 1, 1991
76.981
+20.637
36.63%
jan 1, 1992
56.261
-20.72
-26.92%
jan 1, 1993
48.744
-7.517
-13.36%
jan 1, 1994
49.951
+1.206
2.47%
jan 1, 1995
41.595
-8.355
-16.73%
jan 1, 1996
45.704
+4.109
9.88%
jan 1, 1997
52.04
+6.336
13.86%
jan 1, 1998
40.295
-11.745
-22.57%
jan 1, 1999
60.265
+19.971
49.56%
jan 1, 2000
55.371
-4.894
-8.12%
jan 1, 2001
49.444
-5.927
-10.7%
jan 1, 2002
50.538
+1.094
2.21%
jan 1, 2003
49.092
-1.446
-2.86%
jan 1, 2004
52.104
+3.012
6.14%
jan 1, 2005
59.92
+7.817
15.0%
jan 1, 2006
52.422
-7.498
-12.51%
jan 1, 2007
53.655
+1.232
2.35%
jan 1, 2008
61.353
+7.699
14.35%
jan 1, 2009
56.721
-4.633
-7.55%
jan 1, 2010
53.128
-3.593
-6.33%
jan 1, 2011
61.785
+8.657
16.29%
jan 1, 2012
68.963
+7.178
11.62%
jan 1, 2013
71.245
+2.282
3.31%
jan 1, 2014
74.008
+2.763
3.88%
jan 1, 2015
70.816
-3.192
-4.31%
jan 1, 2016
72.856
+2.04
2.88%
Ranking of countries by current statistics by years


Comments: