29
/
en
AIzaSyAYiBZKx7MnpbEhh9jyipgxe19OcubqV5w
April 1, 2024
107558
Colombia
COL
true
2
1
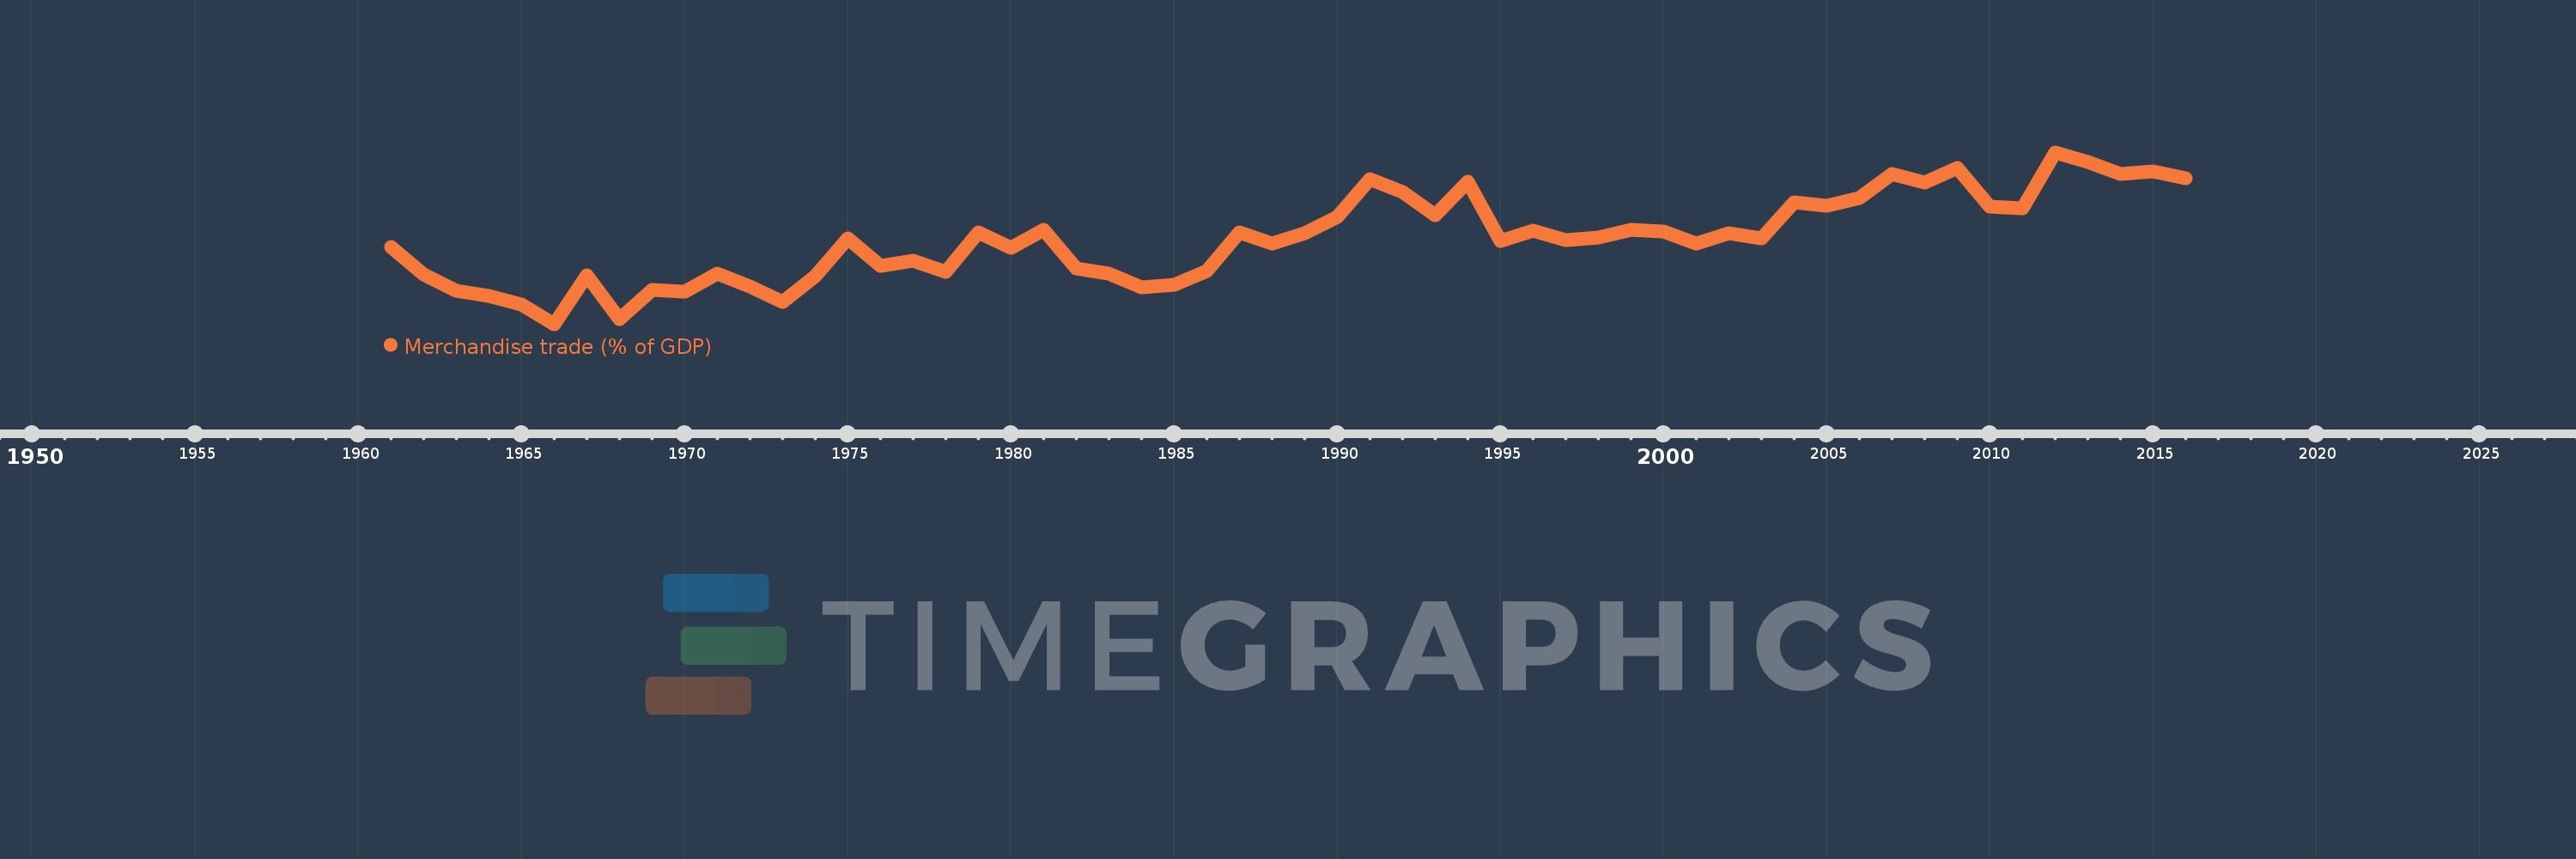
Merchandise trade (% of GDP)
2016,2015,2014,2013,2012,2011,2010,2009,2008,2007,2006,2005,2004,2003,2002,2001,2000,1999,1998,1997,1996,1995,1994,1993,1992,1991,1990,1989,1988,1987,1986,1985,1984,1983,1982,1981,1980,1979,1978,1977,1976,1975,1974,1973,1972,1971,1970,1969,1968,1967,1966,1965,1964,1963,1962,1961
This statistics in other country:
AfghanistanAlbaniaAlgeriaAngolaAntigua and BarbudaArab WorldArgentinaArmeniaArubaAustraliaAustriaAzerbaijanBahamas, TheBahrainBangladeshBarbadosBelarusBelgiumBelizeBeninBermudaBhutanBoliviaBosnia and HerzegovinaBotswanaBrazilBrunei DarussalamBulgariaBurkina FasoBurundiCabo VerdeCambodiaCameroonCanadaCaribbean small statesCentral African RepublicCentral Europe and the BalticsChadChileChinaColombiaComorosCongo, Dem. Rep.Congo, Rep.Costa RicaCote d'IvoireCroatiaCubaCyprusCzech RepublicDenmarkDjiboutiDominicaDominican RepublicEarly-demographic dividendEast Asia & PacificEast Asia & Pacific (excluding high income)East Asia & Pacific (IDA & IBRD countries)EcuadorEgypt, Arab Rep.El SalvadorEquatorial GuineaEritreaEstoniaEthiopiaEuro areaEurope & Central AsiaEurope & Central Asia (excluding high income)Europe & Central Asia (IDA & IBRD countries)European UnionFaroe IslandsFijiFinlandFragile and conflict affected situationsFranceFrench PolynesiaGabonGambia, TheGeorgiaGermanyGhanaGreeceGreenlandGrenadaGuatemalaGuineaGuinea-BissauGuyanaHaitiHeavily indebted poor countries (HIPC)High incomeHondurasHong Kong SAR, ChinaHungaryIBRD onlyIcelandIDA & IBRD totalIDA blendIDA onlyIDA totalIndiaIndonesiaIran, Islamic Rep.IraqIrelandIsraelItalyJamaicaJapanJordanKazakhstanKenyaKiribatiKorea, Rep.KuwaitKyrgyz RepublicLao PDRLate-demographic dividendLatin America & Caribbean Latin America & Caribbean (excluding high income)Latin America & the Caribbean (IDA & IBRD countries)LatviaLeast developed countries: UN classificationLebanonLesothoLiberiaLibyaLithuaniaLow & middle incomeLow incomeLower middle incomeLuxembourgMacao SAR, ChinaMacedonia, FYRMadagascarMalawiMalaysiaMaldivesMaliMaltaMarshall IslandsMauritaniaMauritiusMexicoMicronesia, Fed. Sts.Middle East & North AfricaMiddle East & North Africa (excluding high income)Middle East & North Africa (IDA & IBRD countries)Middle incomeMoldovaMongoliaMontenegroMoroccoMozambiqueMyanmarNamibiaNepalNetherlandsNew CaledoniaNew ZealandNicaraguaNigerNigeriaNorth AmericaNorwayOECD membersOmanOther small statesPacific island small statesPakistanPalauPanamaPapua New GuineaParaguayPeruPhilippinesPolandPortugalPost-demographic dividendPre-demographic dividendQatarRomaniaRussian FederationRwandaSamoaSao Tome and PrincipeSaudi ArabiaSenegalSerbiaSeychellesSierra LeoneSingaporeSlovak RepublicSloveniaSmall statesSolomon IslandsSouth AfricaSouth AsiaSouth Asia (IDA & IBRD)SpainSri LankaSt. Kitts and NevisSt. LuciaSt. Vincent and the GrenadinesSub-Saharan Africa Sub-Saharan Africa (excluding high income)Sub-Saharan Africa (IDA & IBRD countries)SudanSurinameSwazilandSwedenSwitzerlandSyrian Arab RepublicTajikistanTanzaniaThailandTimor-LesteTogoTongaTrinidad and TobagoTunisiaTurkeyTurkmenistanTuvaluUgandaUkraineUnited Arab EmiratesUnited KingdomUnited StatesUpper middle incomeUruguayUzbekistanVanuatuVenezuela, RBVietnamWorldYemen, Rep.ZambiaZimbabwe Timeline:
This timeline shows a graph from 1961 to 2016 of Colombia. No data until 1960. Number of actual observations by date: 56.
Source name:
World Development Indicators
Source organization:
World Trade Organization, and World Bank GDP estimates.
Categories, topics:
Private Sector, Trade
Last updated:
apr 23, 2017
Indicators value changes by year
Minimum:
17.125
jan 1, 1966
Maximum:
33.137
jan 1, 2012
At the date of observation
Value
Absolute change
Change from previous value
jan 1, 1961
24.301
+24.301
0.0%
jan 1, 1962
21.76
-2.542
-10.46%
jan 1, 1963
20.217
-1.543
-7.09%
jan 1, 1964
19.72
-0.497
-2.46%
jan 1, 1965
18.928
-0.792
-4.01%
jan 1, 1966
17.125
-1.803
-9.52%
jan 1, 1967
21.659
+4.533
26.47%
jan 1, 1968
17.583
-4.076
-18.82%
jan 1, 1969
20.308
+2.725
15.5%
jan 1, 1970
20.172
-0.136
-0.67%
jan 1, 1971
21.806
+1.634
8.1%
jan 1, 1972
20.656
-1.15
-5.27%
jan 1, 1973
19.217
-1.439
-6.97%
jan 1, 1974
21.618
+2.401
12.49%
jan 1, 1975
25.107
+3.489
16.14%
jan 1, 1976
22.596
-2.511
-10.0%
jan 1, 1977
23.047
+0.451
1.99%
jan 1, 1978
21.999
-1.048
-4.55%
jan 1, 1979
25.709
+3.71
16.86%
jan 1, 1980
24.247
-1.462
-5.69%
jan 1, 1981
25.937
+1.69
6.97%
jan 1, 1982
22.307
-3.63
-14.0%
jan 1, 1983
21.823
-0.484
-2.17%
jan 1, 1984
20.563
-1.26
-5.77%
jan 1, 1985
20.809
+0.246
1.2%
jan 1, 1986
22.047
+1.238
5.95%
jan 1, 1987
25.654
+3.607
16.36%
jan 1, 1988
24.644
-1.009
-3.93%
jan 1, 1989
25.601
+0.957
3.88%
jan 1, 1990
27.114
+1.513
5.91%
jan 1, 1991
30.68
+3.565
13.15%
jan 1, 1992
29.433
-1.247
-4.06%
jan 1, 1993
27.259
-2.174
-7.39%
jan 1, 1994
30.368
+3.109
11.41%
jan 1, 1995
24.847
-5.521
-18.18%
jan 1, 1996
25.846
+0.998
4.02%
jan 1, 1997
24.979
-0.866
-3.35%
jan 1, 1998
25.22
+0.241
0.97%
jan 1, 1999
25.89
+0.669
2.65%
jan 1, 2000
25.799
-0.091
-0.35%
jan 1, 2001
24.607
-1.192
-4.62%
jan 1, 2002
25.584
+0.977
3.97%
jan 1, 2003
25.142
-0.442
-1.73%
jan 1, 2004
28.482
+3.341
13.29%
jan 1, 2005
28.161
-0.321
-1.13%
jan 1, 2006
28.925
+0.764
2.71%
jan 1, 2007
31.092
+2.167
7.49%
jan 1, 2008
30.32
-0.772
-2.48%
jan 1, 2009
31.68
+1.361
4.49%
jan 1, 2010
28.12
-3.56
-11.24%
jan 1, 2011
27.942
-0.178
-0.63%
jan 1, 2012
33.137
+5.195
18.59%
jan 1, 2013
32.239
-0.899
-2.71%
jan 1, 2014
31.091
-1.148
-3.56%
jan 1, 2015
31.4
+0.309
1.0%
jan 1, 2016
30.727
-0.673
-2.14%
Ranking of countries by current statistics by years


Comments: