29
/
en
AIzaSyAYiBZKx7MnpbEhh9jyipgxe19OcubqV5w
April 1, 2024
164025
Japan
JPN
true
2
1
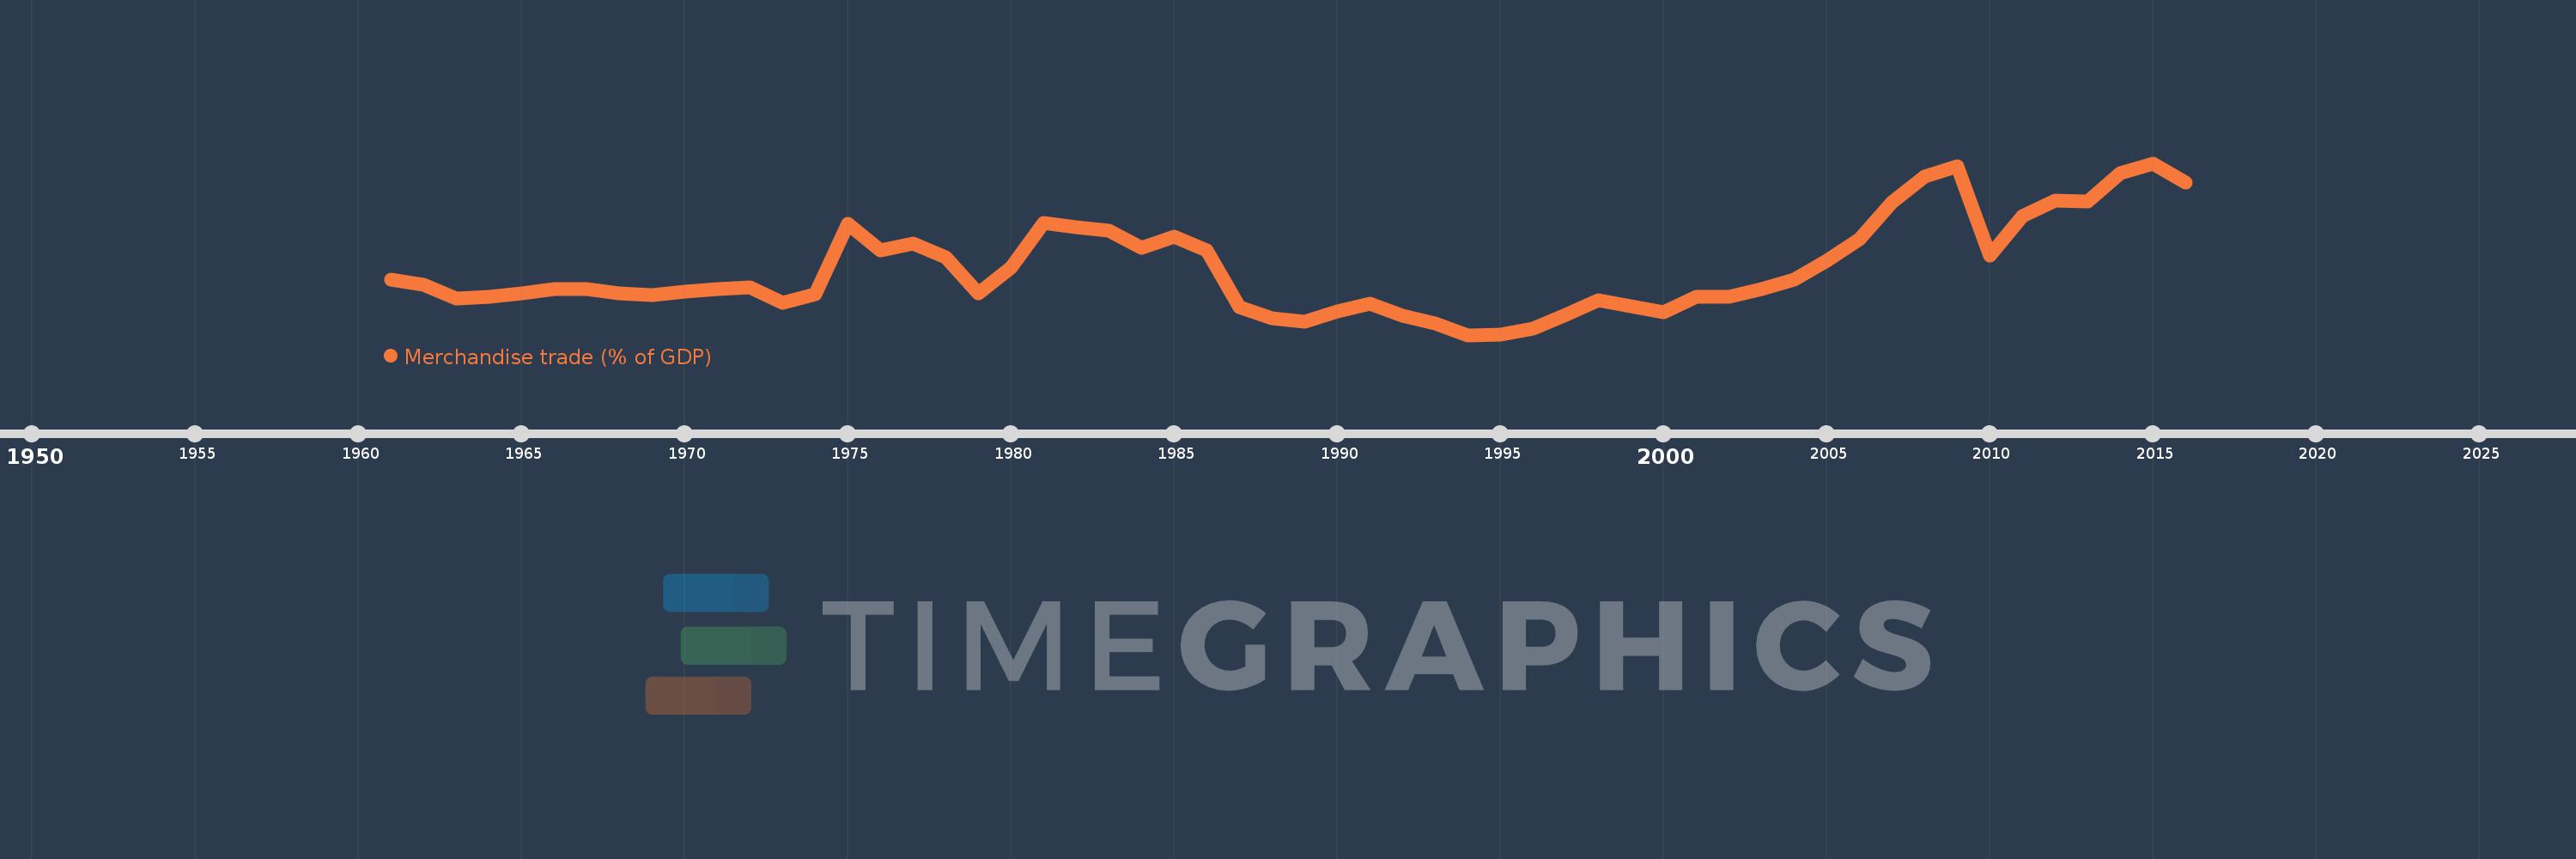
Merchandise trade (% of GDP)
2016,2015,2014,2013,2012,2011,2010,2009,2008,2007,2006,2005,2004,2003,2002,2001,2000,1999,1998,1997,1996,1995,1994,1993,1992,1991,1990,1989,1988,1987,1986,1985,1984,1983,1982,1981,1980,1979,1978,1977,1976,1975,1974,1973,1972,1971,1970,1969,1968,1967,1966,1965,1964,1963,1962,1961
This statistics in other country:
AfghanistanAlbaniaAlgeriaAngolaAntigua and BarbudaArab WorldArgentinaArmeniaArubaAustraliaAustriaAzerbaijanBahamas, TheBahrainBangladeshBarbadosBelarusBelgiumBelizeBeninBermudaBhutanBoliviaBosnia and HerzegovinaBotswanaBrazilBrunei DarussalamBulgariaBurkina FasoBurundiCabo VerdeCambodiaCameroonCanadaCaribbean small statesCentral African RepublicCentral Europe and the BalticsChadChileChinaColombiaComorosCongo, Dem. Rep.Congo, Rep.Costa RicaCote d'IvoireCroatiaCubaCyprusCzech RepublicDenmarkDjiboutiDominicaDominican RepublicEarly-demographic dividendEast Asia & PacificEast Asia & Pacific (excluding high income)East Asia & Pacific (IDA & IBRD countries)EcuadorEgypt, Arab Rep.El SalvadorEquatorial GuineaEritreaEstoniaEthiopiaEuro areaEurope & Central AsiaEurope & Central Asia (excluding high income)Europe & Central Asia (IDA & IBRD countries)European UnionFaroe IslandsFijiFinlandFragile and conflict affected situationsFranceFrench PolynesiaGabonGambia, TheGeorgiaGermanyGhanaGreeceGreenlandGrenadaGuatemalaGuineaGuinea-BissauGuyanaHaitiHeavily indebted poor countries (HIPC)High incomeHondurasHong Kong SAR, ChinaHungaryIBRD onlyIcelandIDA & IBRD totalIDA blendIDA onlyIDA totalIndiaIndonesiaIran, Islamic Rep.IraqIrelandIsraelItalyJamaicaJapanJordanKazakhstanKenyaKiribatiKorea, Rep.KuwaitKyrgyz RepublicLao PDRLate-demographic dividendLatin America & Caribbean Latin America & Caribbean (excluding high income)Latin America & the Caribbean (IDA & IBRD countries)LatviaLeast developed countries: UN classificationLebanonLesothoLiberiaLibyaLithuaniaLow & middle incomeLow incomeLower middle incomeLuxembourgMacao SAR, ChinaMacedonia, FYRMadagascarMalawiMalaysiaMaldivesMaliMaltaMarshall IslandsMauritaniaMauritiusMexicoMicronesia, Fed. Sts.Middle East & North AfricaMiddle East & North Africa (excluding high income)Middle East & North Africa (IDA & IBRD countries)Middle incomeMoldovaMongoliaMontenegroMoroccoMozambiqueMyanmarNamibiaNepalNetherlandsNew CaledoniaNew ZealandNicaraguaNigerNigeriaNorth AmericaNorwayOECD membersOmanOther small statesPacific island small statesPakistanPalauPanamaPapua New GuineaParaguayPeruPhilippinesPolandPortugalPost-demographic dividendPre-demographic dividendQatarRomaniaRussian FederationRwandaSamoaSao Tome and PrincipeSaudi ArabiaSenegalSerbiaSeychellesSierra LeoneSingaporeSlovak RepublicSloveniaSmall statesSolomon IslandsSouth AfricaSouth AsiaSouth Asia (IDA & IBRD)SpainSri LankaSt. Kitts and NevisSt. LuciaSt. Vincent and the GrenadinesSub-Saharan Africa Sub-Saharan Africa (excluding high income)Sub-Saharan Africa (IDA & IBRD countries)SudanSurinameSwazilandSwedenSwitzerlandSyrian Arab RepublicTajikistanTanzaniaThailandTimor-LesteTogoTongaTrinidad and TobagoTunisiaTurkeyTurkmenistanTuvaluUgandaUkraineUnited Arab EmiratesUnited KingdomUnited StatesUpper middle incomeUruguayUzbekistanVanuatuVenezuela, RBVietnamWorldYemen, Rep.ZambiaZimbabwe Timeline:
This timeline shows a graph from 1961 to 2016 of Japan. No data until 1960. Number of actual observations by date: 56.
Source name:
World Development Indicators
Source organization:
World Trade Organization, and World Bank GDP estimates.
Categories, topics:
Private Sector, Trade
Last updated:
apr 23, 2017
Indicators value changes by year
Minimum:
13.678
jan 1, 1994
Maximum:
30.985
jan 1, 2015
At the date of observation
Value
Absolute change
Change from previous value
jan 1, 1961
19.288
+19.288
0.0%
jan 1, 1962
18.774
-0.513
-2.66%
jan 1, 1963
17.378
-1.396
-7.44%
jan 1, 1964
17.537
+0.159
0.92%
jan 1, 1965
17.872
+0.335
1.91%
jan 1, 1966
18.274
+0.402
2.25%
jan 1, 1967
18.271
-0.004
-0.02%
jan 1, 1968
17.858
-0.413
-2.26%
jan 1, 1969
17.707
-0.151
-0.84%
jan 1, 1970
18.009
+0.302
1.71%
jan 1, 1971
18.271
+0.261
1.45%
jan 1, 1972
18.508
+0.237
1.3%
jan 1, 1973
16.931
-1.576
-8.52%
jan 1, 1974
17.747
+0.816
4.82%
jan 1, 1975
24.895
+7.148
40.28%
jan 1, 1976
22.166
-2.73
-10.96%
jan 1, 1977
22.935
+0.769
3.47%
jan 1, 1978
21.486
-1.449
-6.32%
jan 1, 1979
17.872
-3.614
-16.82%
jan 1, 1980
20.447
+2.576
14.41%
jan 1, 1981
24.999
+4.552
22.26%
jan 1, 1982
24.5
-0.499
-2.0%
jan 1, 1983
24.165
-0.335
-1.37%
jan 1, 1984
22.445
-1.72
-7.12%
jan 1, 1985
23.627
+1.182
5.27%
jan 1, 1986
22.221
-1.406
-5.95%
jan 1, 1987
16.494
-5.726
-25.77%
jan 1, 1988
15.384
-1.111
-6.73%
jan 1, 1989
14.998
-0.386
-2.51%
jan 1, 1990
16.03
+1.033
6.89%
jan 1, 1991
16.849
+0.819
5.11%
jan 1, 1992
15.601
-1.248
-7.41%
jan 1, 1993
14.876
-0.726
-4.65%
jan 1, 1994
13.678
-1.198
-8.05%
jan 1, 1995
13.7
+0.022
0.16%
jan 1, 1996
14.296
+0.596
4.35%
jan 1, 1997
15.724
+1.428
9.99%
jan 1, 1998
17.209
+1.485
9.44%
jan 1, 1999
16.576
-0.633
-3.68%
jan 1, 2000
15.949
-0.627
-3.78%
jan 1, 2001
17.57
+1.621
10.17%
jan 1, 2002
17.488
-0.083
-0.47%
jan 1, 2003
18.321
+0.833
4.76%
jan 1, 2004
19.227
+0.906
4.94%
jan 1, 2005
21.188
+1.961
10.2%
jan 1, 2006
23.359
+2.171
10.25%
jan 1, 2007
27.057
+3.698
15.83%
jan 1, 2008
29.601
+2.544
9.4%
jan 1, 2009
30.647
+1.045
3.53%
jan 1, 2010
21.652
-8.995
-29.35%
jan 1, 2011
25.681
+4.029
18.61%
jan 1, 2012
27.261
+1.58
6.15%
jan 1, 2013
27.154
-0.107
-0.39%
jan 1, 2014
30.03
+2.876
10.59%
jan 1, 2015
30.985
+0.955
3.18%
jan 1, 2016
29.053
-1.932
-6.24%
Ranking of countries by current statistics by years


Comments: