29
/
en
AIzaSyAYiBZKx7MnpbEhh9jyipgxe19OcubqV5w
April 1, 2024
59130
Sub-Saharan Africa
SSF
false
2
1
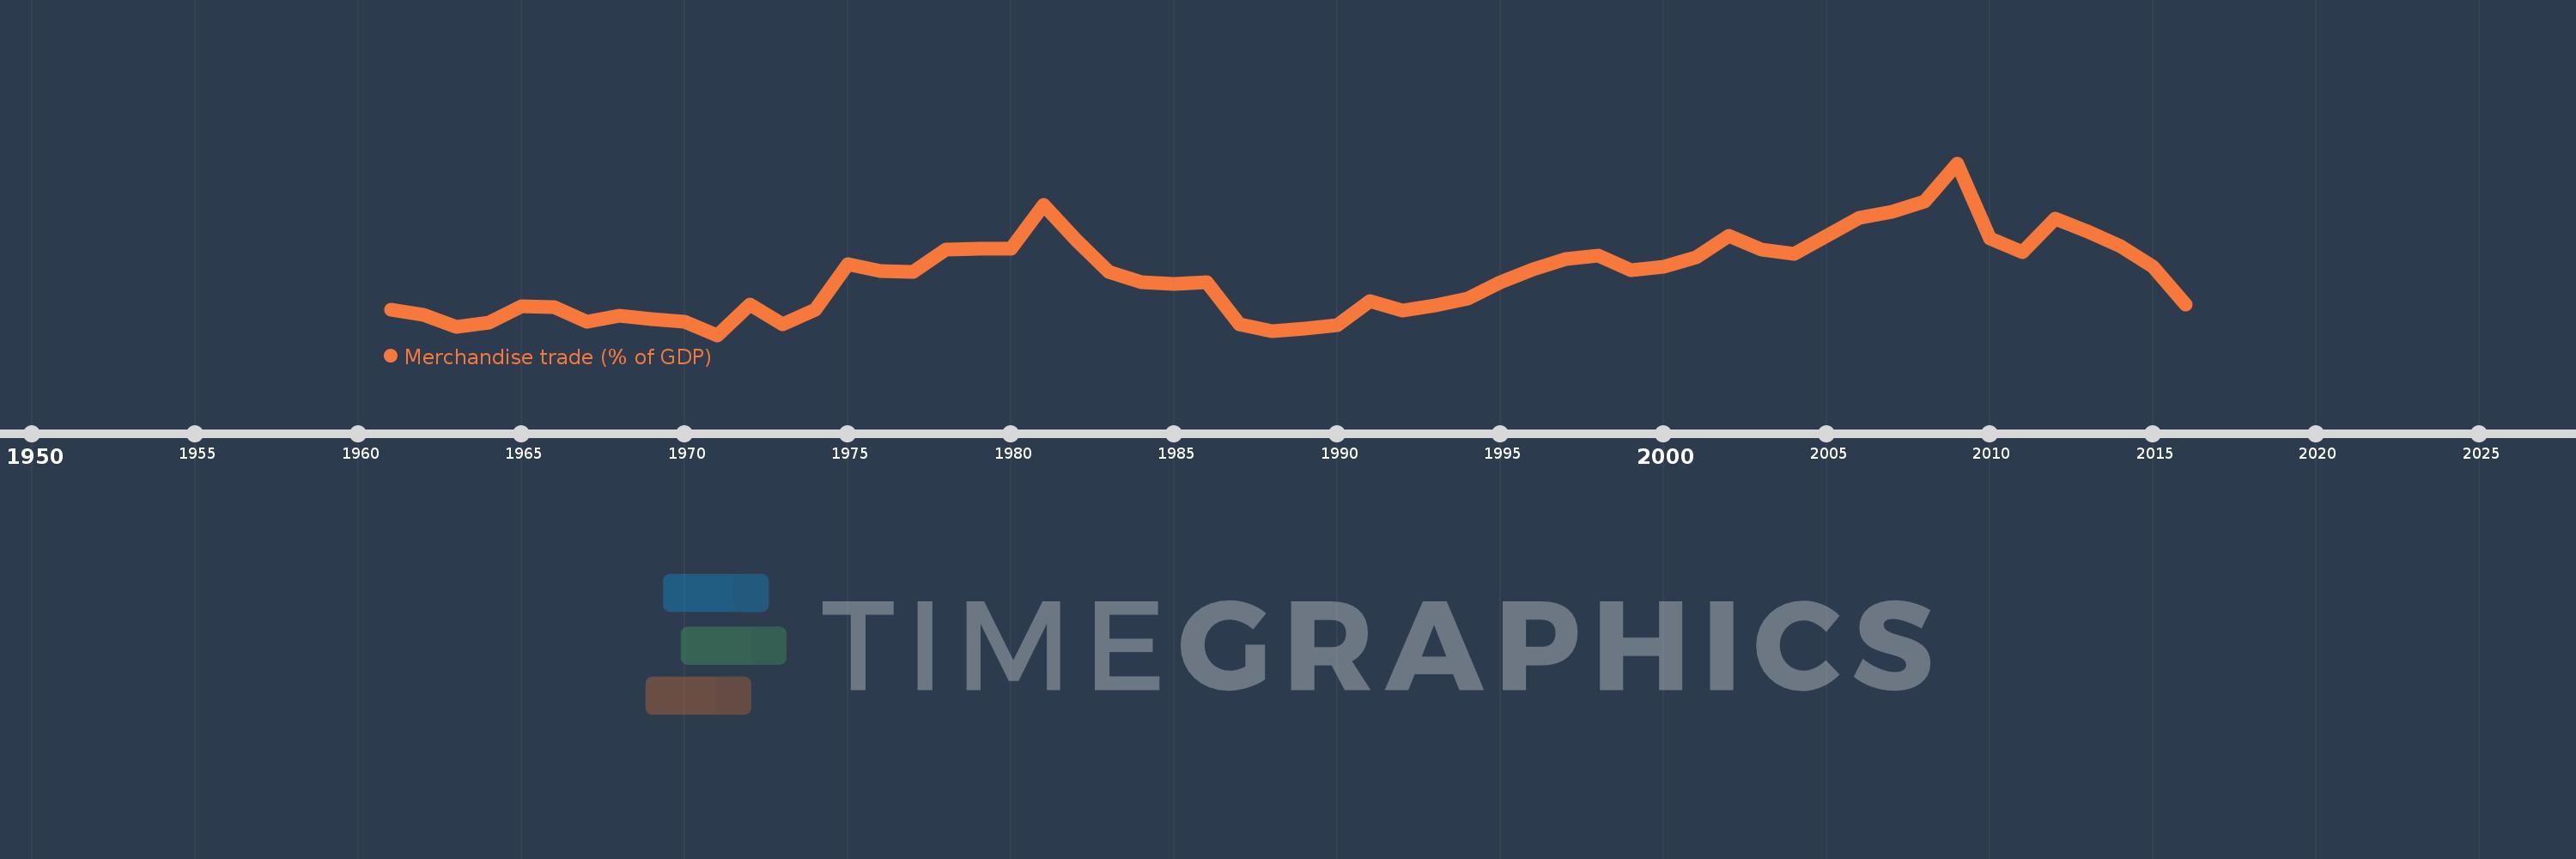
Merchandise trade (% of GDP)
2016,2015,2014,2013,2012,2011,2010,2009,2008,2007,2006,2005,2004,2003,2002,2001,2000,1999,1998,1997,1996,1995,1994,1993,1992,1991,1990,1989,1988,1987,1986,1985,1984,1983,1982,1981,1980,1979,1978,1977,1976,1975,1974,1973,1972,1971,1970,1969,1968,1967,1966,1965,1964,1963,1962,1961
This statistics in other country:
AfghanistanAlbaniaAlgeriaAngolaAntigua and BarbudaArab WorldArgentinaArmeniaArubaAustraliaAustriaAzerbaijanBahamas, TheBahrainBangladeshBarbadosBelarusBelgiumBelizeBeninBermudaBhutanBoliviaBosnia and HerzegovinaBotswanaBrazilBrunei DarussalamBulgariaBurkina FasoBurundiCabo VerdeCambodiaCameroonCanadaCaribbean small statesCentral African RepublicCentral Europe and the BalticsChadChileChinaColombiaComorosCongo, Dem. Rep.Congo, Rep.Costa RicaCote d'IvoireCroatiaCubaCyprusCzech RepublicDenmarkDjiboutiDominicaDominican RepublicEarly-demographic dividendEast Asia & PacificEast Asia & Pacific (excluding high income)East Asia & Pacific (IDA & IBRD countries)EcuadorEgypt, Arab Rep.El SalvadorEquatorial GuineaEritreaEstoniaEthiopiaEuro areaEurope & Central AsiaEurope & Central Asia (excluding high income)Europe & Central Asia (IDA & IBRD countries)European UnionFaroe IslandsFijiFinlandFragile and conflict affected situationsFranceFrench PolynesiaGabonGambia, TheGeorgiaGermanyGhanaGreeceGreenlandGrenadaGuatemalaGuineaGuinea-BissauGuyanaHaitiHeavily indebted poor countries (HIPC)High incomeHondurasHong Kong SAR, ChinaHungaryIBRD onlyIcelandIDA & IBRD totalIDA blendIDA onlyIDA totalIndiaIndonesiaIran, Islamic Rep.IraqIrelandIsraelItalyJamaicaJapanJordanKazakhstanKenyaKiribatiKorea, Rep.KuwaitKyrgyz RepublicLao PDRLate-demographic dividendLatin America & Caribbean Latin America & Caribbean (excluding high income)Latin America & the Caribbean (IDA & IBRD countries)LatviaLeast developed countries: UN classificationLebanonLesothoLiberiaLibyaLithuaniaLow & middle incomeLow incomeLower middle incomeLuxembourgMacao SAR, ChinaMacedonia, FYRMadagascarMalawiMalaysiaMaldivesMaliMaltaMarshall IslandsMauritaniaMauritiusMexicoMicronesia, Fed. Sts.Middle East & North AfricaMiddle East & North Africa (excluding high income)Middle East & North Africa (IDA & IBRD countries)Middle incomeMoldovaMongoliaMontenegroMoroccoMozambiqueMyanmarNamibiaNepalNetherlandsNew CaledoniaNew ZealandNicaraguaNigerNigeriaNorth AmericaNorwayOECD membersOmanOther small statesPacific island small statesPakistanPalauPanamaPapua New GuineaParaguayPeruPhilippinesPolandPortugalPost-demographic dividendPre-demographic dividendQatarRomaniaRussian FederationRwandaSamoaSao Tome and PrincipeSaudi ArabiaSenegalSerbiaSeychellesSierra LeoneSingaporeSlovak RepublicSloveniaSmall statesSolomon IslandsSouth AfricaSouth AsiaSouth Asia (IDA & IBRD)SpainSri LankaSt. Kitts and NevisSt. LuciaSt. Vincent and the GrenadinesSub-Saharan Africa Sub-Saharan Africa (excluding high income)Sub-Saharan Africa (IDA & IBRD countries)SudanSurinameSwazilandSwedenSwitzerlandSyrian Arab RepublicTajikistanTanzaniaThailandTimor-LesteTogoTongaTrinidad and TobagoTunisiaTurkeyTurkmenistanTuvaluUgandaUkraineUnited Arab EmiratesUnited KingdomUnited StatesUpper middle incomeUruguayUzbekistanVanuatuVenezuela, RBVietnamWorldYemen, Rep.ZambiaZimbabwe Timeline:
This timeline shows a graph from 1961 to 2016 of Sub-Saharan Africa . No data until 1960. Number of actual observations by date: 56.
Source name:
World Development Indicators
Source organization:
World Trade Organization, and World Bank GDP estimates.
Categories, topics:
Private Sector, Trade
Last updated:
apr 23, 2017
Indicators value changes by year
Minimum:
35.899
jan 1, 1971
Maximum:
63.959
jan 1, 2009
At the date of observation
Value
Absolute change
Change from previous value
jan 1, 1961
40.019
+40.019
0.0%
jan 1, 1962
39.163
-0.856
-2.14%
jan 1, 1963
37.215
-1.948
-4.98%
jan 1, 1964
37.989
+0.774
2.08%
jan 1, 1965
40.628
+2.64
6.95%
jan 1, 1966
40.519
-0.109
-0.27%
jan 1, 1967
38.025
-2.495
-6.16%
jan 1, 1968
39.113
+1.088
2.86%
jan 1, 1969
38.494
-0.62
-1.58%
jan 1, 1970
38.012
-0.482
-1.25%
jan 1, 1971
35.899
-2.113
-5.56%
jan 1, 1972
40.865
+4.966
13.83%
jan 1, 1973
37.59
-3.276
-8.02%
jan 1, 1974
40.045
+2.456
6.53%
jan 1, 1975
47.47
+7.425
18.54%
jan 1, 1976
46.398
-1.072
-2.26%
jan 1, 1977
46.152
-0.246
-0.53%
jan 1, 1978
49.867
+3.715
8.05%
jan 1, 1979
50.019
+0.152
0.3%
jan 1, 1980
50.063
+0.044
0.09%
jan 1, 1981
57.199
+7.137
14.26%
jan 1, 1982
51.429
-5.771
-10.09%
jan 1, 1983
46.216
-5.213
-10.14%
jan 1, 1984
44.506
-1.709
-3.7%
jan 1, 1985
44.253
-0.253
-0.57%
jan 1, 1986
44.571
+0.318
0.72%
jan 1, 1987
37.663
-6.908
-15.5%
jan 1, 1988
36.482
-1.182
-3.14%
jan 1, 1989
36.905
+0.423
1.16%
jan 1, 1990
37.58
+0.675
1.83%
jan 1, 1991
41.497
+3.917
10.42%
jan 1, 1992
39.855
-1.642
-3.96%
jan 1, 1993
40.677
+0.822
2.06%
jan 1, 1994
41.916
+1.239
3.05%
jan 1, 1995
44.459
+2.543
6.07%
jan 1, 1996
46.625
+2.166
4.87%
jan 1, 1997
48.253
+1.628
3.49%
jan 1, 1998
48.855
+0.602
1.25%
jan 1, 1999
46.436
-2.419
-4.95%
jan 1, 2000
47.0
+0.563
1.21%
jan 1, 2001
48.569
+1.57
3.34%
jan 1, 2002
52.099
+3.53
7.27%
jan 1, 2003
49.919
-2.18
-4.18%
jan 1, 2004
49.168
-0.751
-1.5%
jan 1, 2005
52.067
+2.899
5.9%
jan 1, 2006
55.02
+2.953
5.67%
jan 1, 2007
56.066
+1.047
1.9%
jan 1, 2008
57.773
+1.707
3.04%
jan 1, 2009
63.959
+6.186
10.71%
jan 1, 2010
51.739
-12.22
-19.11%
jan 1, 2011
49.393
-2.345
-4.53%
jan 1, 2012
54.893
+5.499
11.13%
jan 1, 2013
52.766
-2.126
-3.87%
jan 1, 2014
50.459
-2.307
-4.37%
jan 1, 2015
47.077
-3.382
-6.7%
jan 1, 2016
40.818
-6.259
-13.3%
Ranking of countries by current statistics by years


Comments: