29
/
en
AIzaSyAYiBZKx7MnpbEhh9jyipgxe19OcubqV5w
April 1, 2024
245898
South Africa
ZAF
true
2
1
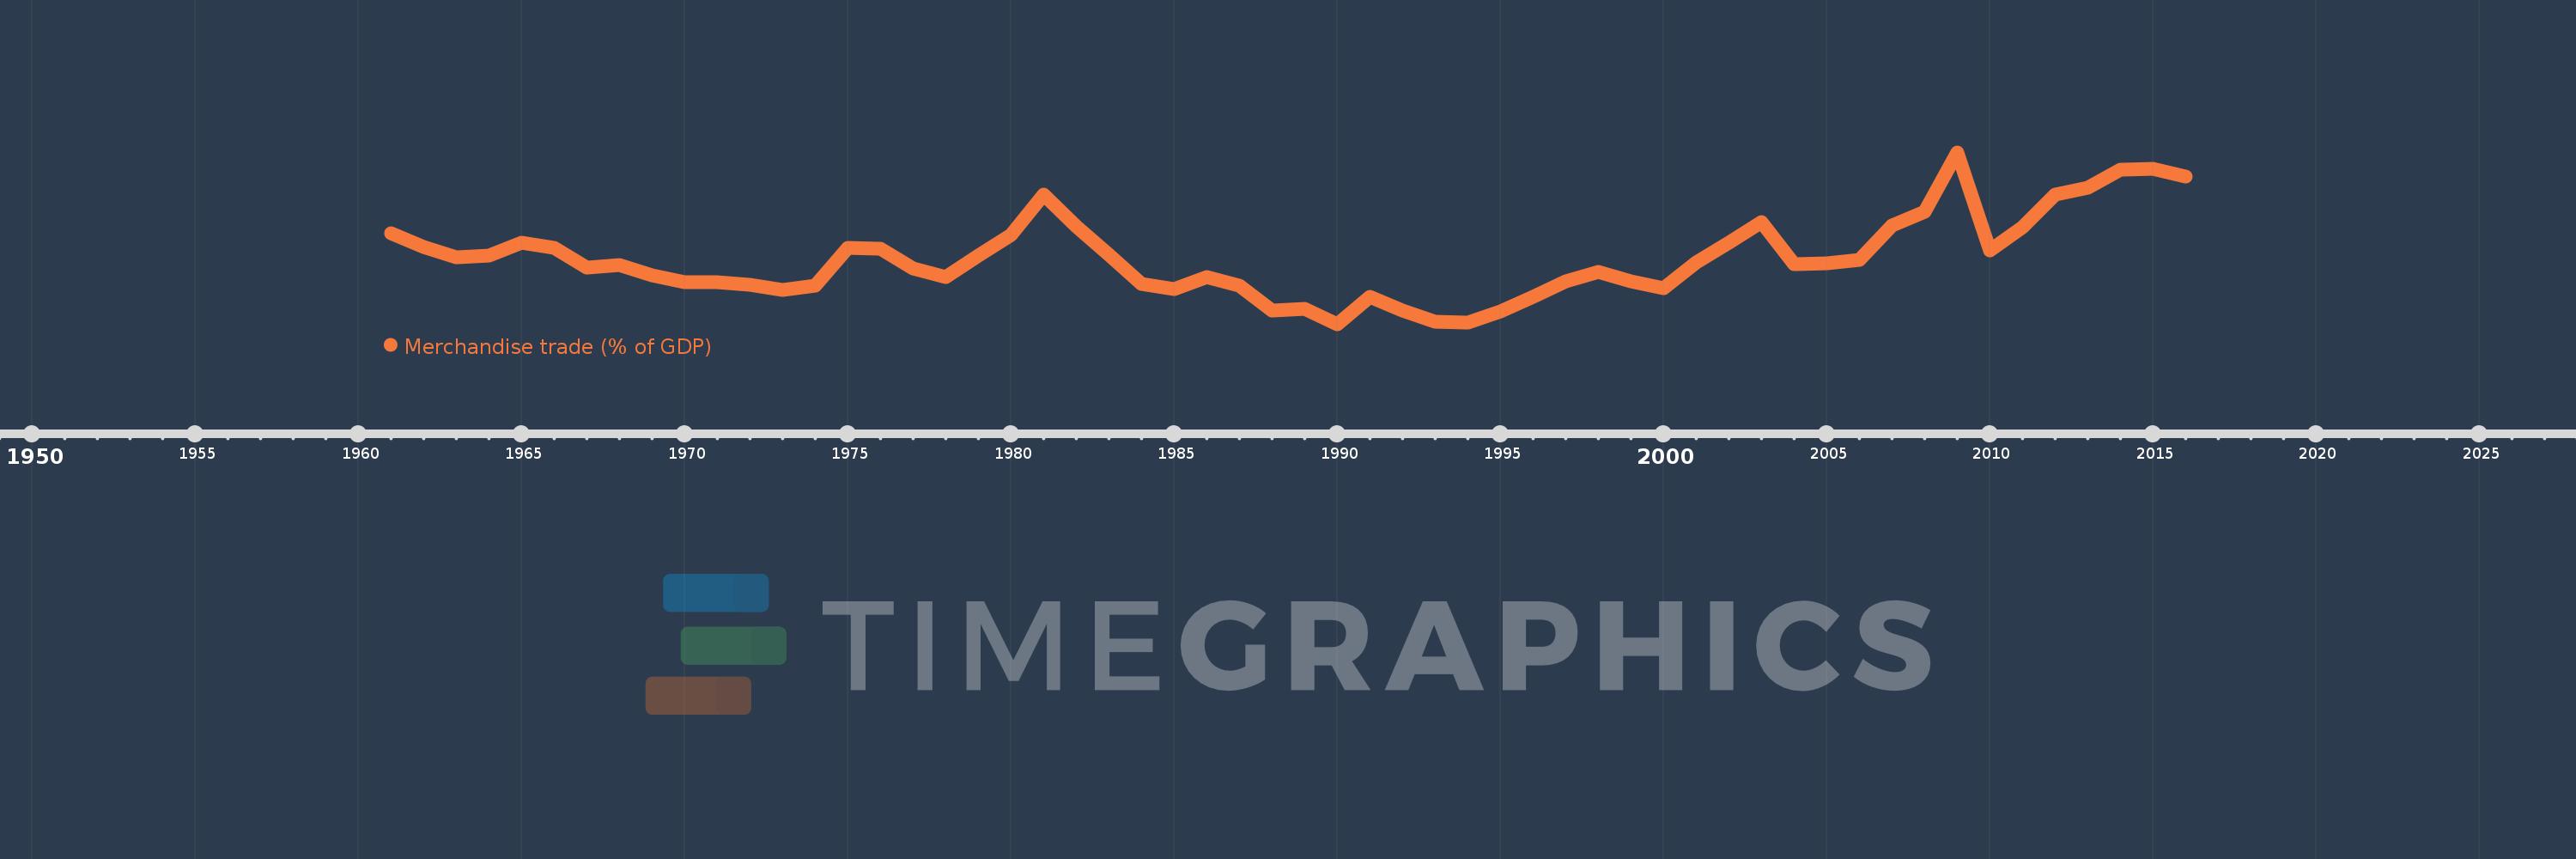
Merchandise trade (% of GDP)
2016,2015,2014,2013,2012,2011,2010,2009,2008,2007,2006,2005,2004,2003,2002,2001,2000,1999,1998,1997,1996,1995,1994,1993,1992,1991,1990,1989,1988,1987,1986,1985,1984,1983,1982,1981,1980,1979,1978,1977,1976,1975,1974,1973,1972,1971,1970,1969,1968,1967,1966,1965,1964,1963,1962,1961
This statistics in other country:
AfghanistanAlbaniaAlgeriaAngolaAntigua and BarbudaArab WorldArgentinaArmeniaArubaAustraliaAustriaAzerbaijanBahamas, TheBahrainBangladeshBarbadosBelarusBelgiumBelizeBeninBermudaBhutanBoliviaBosnia and HerzegovinaBotswanaBrazilBrunei DarussalamBulgariaBurkina FasoBurundiCabo VerdeCambodiaCameroonCanadaCaribbean small statesCentral African RepublicCentral Europe and the BalticsChadChileChinaColombiaComorosCongo, Dem. Rep.Congo, Rep.Costa RicaCote d'IvoireCroatiaCubaCyprusCzech RepublicDenmarkDjiboutiDominicaDominican RepublicEarly-demographic dividendEast Asia & PacificEast Asia & Pacific (excluding high income)East Asia & Pacific (IDA & IBRD countries)EcuadorEgypt, Arab Rep.El SalvadorEquatorial GuineaEritreaEstoniaEthiopiaEuro areaEurope & Central AsiaEurope & Central Asia (excluding high income)Europe & Central Asia (IDA & IBRD countries)European UnionFaroe IslandsFijiFinlandFragile and conflict affected situationsFranceFrench PolynesiaGabonGambia, TheGeorgiaGermanyGhanaGreeceGreenlandGrenadaGuatemalaGuineaGuinea-BissauGuyanaHaitiHeavily indebted poor countries (HIPC)High incomeHondurasHong Kong SAR, ChinaHungaryIBRD onlyIcelandIDA & IBRD totalIDA blendIDA onlyIDA totalIndiaIndonesiaIran, Islamic Rep.IraqIrelandIsraelItalyJamaicaJapanJordanKazakhstanKenyaKiribatiKorea, Rep.KuwaitKyrgyz RepublicLao PDRLate-demographic dividendLatin America & Caribbean Latin America & Caribbean (excluding high income)Latin America & the Caribbean (IDA & IBRD countries)LatviaLeast developed countries: UN classificationLebanonLesothoLiberiaLibyaLithuaniaLow & middle incomeLow incomeLower middle incomeLuxembourgMacao SAR, ChinaMacedonia, FYRMadagascarMalawiMalaysiaMaldivesMaliMaltaMarshall IslandsMauritaniaMauritiusMexicoMicronesia, Fed. Sts.Middle East & North AfricaMiddle East & North Africa (excluding high income)Middle East & North Africa (IDA & IBRD countries)Middle incomeMoldovaMongoliaMontenegroMoroccoMozambiqueMyanmarNamibiaNepalNetherlandsNew CaledoniaNew ZealandNicaraguaNigerNigeriaNorth AmericaNorwayOECD membersOmanOther small statesPacific island small statesPakistanPalauPanamaPapua New GuineaParaguayPeruPhilippinesPolandPortugalPost-demographic dividendPre-demographic dividendQatarRomaniaRussian FederationRwandaSamoaSao Tome and PrincipeSaudi ArabiaSenegalSerbiaSeychellesSierra LeoneSingaporeSlovak RepublicSloveniaSmall statesSolomon IslandsSouth AfricaSouth AsiaSouth Asia (IDA & IBRD)SpainSri LankaSt. Kitts and NevisSt. LuciaSt. Vincent and the GrenadinesSub-Saharan Africa Sub-Saharan Africa (excluding high income)Sub-Saharan Africa (IDA & IBRD countries)SudanSurinameSwazilandSwedenSwitzerlandSyrian Arab RepublicTajikistanTanzaniaThailandTimor-LesteTogoTongaTrinidad and TobagoTunisiaTurkeyTurkmenistanTuvaluUgandaUkraineUnited Arab EmiratesUnited KingdomUnited StatesUpper middle incomeUruguayUzbekistanVanuatuVenezuela, RBVietnamWorldYemen, Rep.ZambiaZimbabwe Timeline:
This timeline shows a graph from 1961 to 2016 of South Africa. No data until 1960. Number of actual observations by date: 56.
Source name:
World Development Indicators
Source organization:
World Trade Organization, and World Bank GDP estimates.
Categories, topics:
Private Sector, Trade
Last updated:
apr 23, 2017
Indicators value changes by year
Minimum:
32.575
jan 1, 1990
Maximum:
63.613
jan 1, 2009
At the date of observation
Value
Absolute change
Change from previous value
jan 1, 1961
49.078
+49.078
0.0%
jan 1, 1962
46.486
-2.592
-5.28%
jan 1, 1963
44.681
-1.805
-3.88%
jan 1, 1964
45.019
+0.337
0.76%
jan 1, 1965
47.262
+2.243
4.98%
jan 1, 1966
46.442
-0.82
-1.74%
jan 1, 1967
42.822
-3.62
-7.79%
jan 1, 1968
43.274
+0.452
1.06%
jan 1, 1969
41.403
-1.871
-4.32%
jan 1, 1970
40.123
-1.28
-3.09%
jan 1, 1971
40.137
+0.014
0.04%
jan 1, 1972
39.699
-0.438
-1.09%
jan 1, 1973
38.817
-0.882
-2.22%
jan 1, 1974
39.472
+0.655
1.69%
jan 1, 1975
46.307
+6.835
17.31%
jan 1, 1976
46.232
-0.075
-0.16%
jan 1, 1977
42.665
-3.567
-7.72%
jan 1, 1978
41.052
-1.613
-3.78%
jan 1, 1979
44.977
+3.925
9.56%
jan 1, 1980
48.708
+3.732
8.3%
jan 1, 1981
56.021
+7.312
15.01%
jan 1, 1982
50.191
-5.83
-10.41%
jan 1, 1983
45.053
-5.138
-10.24%
jan 1, 1984
39.901
-5.152
-11.44%
jan 1, 1985
38.885
-1.016
-2.55%
jan 1, 1986
41.172
+2.287
5.88%
jan 1, 1987
39.466
-1.706
-4.14%
jan 1, 1988
35.084
-4.382
-11.1%
jan 1, 1989
35.413
+0.329
0.94%
jan 1, 1990
32.575
-2.838
-8.01%
jan 1, 1991
37.449
+4.873
14.96%
jan 1, 1992
35.024
-2.425
-6.47%
jan 1, 1993
33.083
-1.941
-5.54%
jan 1, 1994
32.919
-0.164
-0.5%
jan 1, 1995
34.827
+1.908
5.8%
jan 1, 1996
37.565
+2.739
7.86%
jan 1, 1997
40.244
+2.679
7.13%
jan 1, 1998
41.96
+1.716
4.26%
jan 1, 1999
40.359
-1.601
-3.82%
jan 1, 2000
39.085
-1.273
-3.16%
jan 1, 2001
43.764
+4.679
11.97%
jan 1, 2002
47.324
+3.559
8.13%
jan 1, 2003
51.081
+3.758
7.94%
jan 1, 2004
43.496
-7.585
-14.85%
jan 1, 2005
43.576
+0.08
0.18%
jan 1, 2006
44.198
+0.622
1.43%
jan 1, 2007
50.394
+6.196
14.02%
jan 1, 2008
52.848
+2.454
4.87%
jan 1, 2009
63.613
+10.765
20.37%
jan 1, 2010
45.865
-17.748
-27.9%
jan 1, 2011
50.135
+4.271
9.31%
jan 1, 2012
56.012
+5.877
11.72%
jan 1, 2013
57.213
+1.201
2.14%
jan 1, 2014
60.474
+3.261
5.7%
jan 1, 2015
60.634
+0.161
0.27%
jan 1, 2016
59.221
-1.414
-2.33%
Ranking of countries by current statistics by years


Comments: