29
/
en
AIzaSyAYiBZKx7MnpbEhh9jyipgxe19OcubqV5w
April 1, 2024
269635
Turkey
TUR
true
2
1
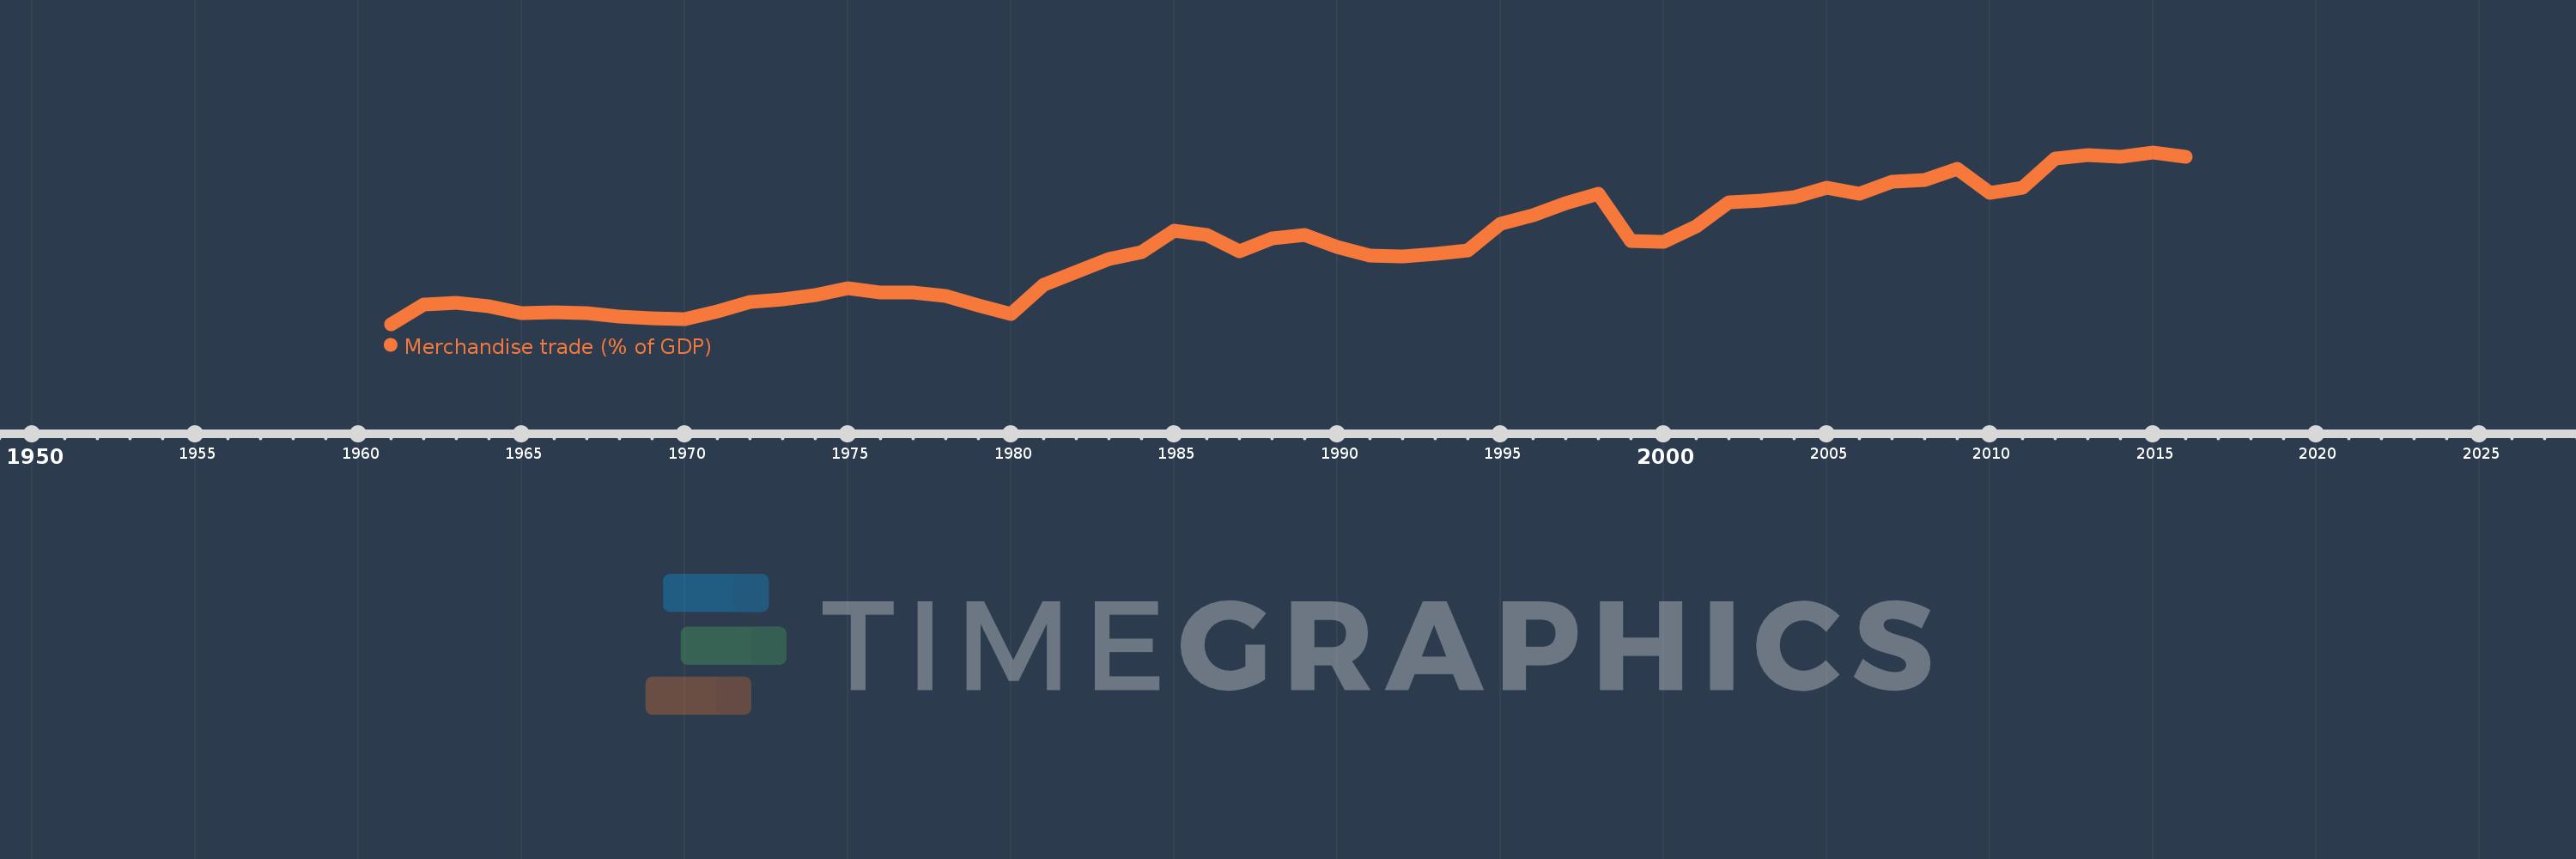
Merchandise trade (% of GDP)
2016,2015,2014,2013,2012,2011,2010,2009,2008,2007,2006,2005,2004,2003,2002,2001,2000,1999,1998,1997,1996,1995,1994,1993,1992,1991,1990,1989,1988,1987,1986,1985,1984,1983,1982,1981,1980,1979,1978,1977,1976,1975,1974,1973,1972,1971,1970,1969,1968,1967,1966,1965,1964,1963,1962,1961
This statistics in other country:
AfghanistanAlbaniaAlgeriaAngolaAntigua and BarbudaArab WorldArgentinaArmeniaArubaAustraliaAustriaAzerbaijanBahamas, TheBahrainBangladeshBarbadosBelarusBelgiumBelizeBeninBermudaBhutanBoliviaBosnia and HerzegovinaBotswanaBrazilBrunei DarussalamBulgariaBurkina FasoBurundiCabo VerdeCambodiaCameroonCanadaCaribbean small statesCentral African RepublicCentral Europe and the BalticsChadChileChinaColombiaComorosCongo, Dem. Rep.Congo, Rep.Costa RicaCote d'IvoireCroatiaCubaCyprusCzech RepublicDenmarkDjiboutiDominicaDominican RepublicEarly-demographic dividendEast Asia & PacificEast Asia & Pacific (excluding high income)East Asia & Pacific (IDA & IBRD countries)EcuadorEgypt, Arab Rep.El SalvadorEquatorial GuineaEritreaEstoniaEthiopiaEuro areaEurope & Central AsiaEurope & Central Asia (excluding high income)Europe & Central Asia (IDA & IBRD countries)European UnionFaroe IslandsFijiFinlandFragile and conflict affected situationsFranceFrench PolynesiaGabonGambia, TheGeorgiaGermanyGhanaGreeceGreenlandGrenadaGuatemalaGuineaGuinea-BissauGuyanaHaitiHeavily indebted poor countries (HIPC)High incomeHondurasHong Kong SAR, ChinaHungaryIBRD onlyIcelandIDA & IBRD totalIDA blendIDA onlyIDA totalIndiaIndonesiaIran, Islamic Rep.IraqIrelandIsraelItalyJamaicaJapanJordanKazakhstanKenyaKiribatiKorea, Rep.KuwaitKyrgyz RepublicLao PDRLate-demographic dividendLatin America & Caribbean Latin America & Caribbean (excluding high income)Latin America & the Caribbean (IDA & IBRD countries)LatviaLeast developed countries: UN classificationLebanonLesothoLiberiaLibyaLithuaniaLow & middle incomeLow incomeLower middle incomeLuxembourgMacao SAR, ChinaMacedonia, FYRMadagascarMalawiMalaysiaMaldivesMaliMaltaMarshall IslandsMauritaniaMauritiusMexicoMicronesia, Fed. Sts.Middle East & North AfricaMiddle East & North Africa (excluding high income)Middle East & North Africa (IDA & IBRD countries)Middle incomeMoldovaMongoliaMontenegroMoroccoMozambiqueMyanmarNamibiaNepalNetherlandsNew CaledoniaNew ZealandNicaraguaNigerNigeriaNorth AmericaNorwayOECD membersOmanOther small statesPacific island small statesPakistanPalauPanamaPapua New GuineaParaguayPeruPhilippinesPolandPortugalPost-demographic dividendPre-demographic dividendQatarRomaniaRussian FederationRwandaSamoaSao Tome and PrincipeSaudi ArabiaSenegalSerbiaSeychellesSierra LeoneSingaporeSlovak RepublicSloveniaSmall statesSolomon IslandsSouth AfricaSouth AsiaSouth Asia (IDA & IBRD)SpainSri LankaSt. Kitts and NevisSt. LuciaSt. Vincent and the GrenadinesSub-Saharan Africa Sub-Saharan Africa (excluding high income)Sub-Saharan Africa (IDA & IBRD countries)SudanSurinameSwazilandSwedenSwitzerlandSyrian Arab RepublicTajikistanTanzaniaThailandTimor-LesteTogoTongaTrinidad and TobagoTunisiaTurkeyTurkmenistanTuvaluUgandaUkraineUnited Arab EmiratesUnited KingdomUnited StatesUpper middle incomeUruguayUzbekistanVanuatuVenezuela, RBVietnamWorldYemen, Rep.ZambiaZimbabwe Timeline:
This timeline shows a graph from 1961 to 2016 of Turkey. No data until 1960. Number of actual observations by date: 56.
Source name:
World Development Indicators
Source organization:
World Trade Organization, and World Bank GDP estimates.
Categories, topics:
Private Sector, Trade
Last updated:
apr 23, 2017
Indicators value changes by year
At the date of observation
Value
Absolute change
Change from previous value
jan 1, 1961
5.637
+5.637
0.0%
jan 1, 1962
10.645
+5.007
88.83%
jan 1, 1963
11.215
+0.57
5.35%
jan 1, 1964
10.194
-1.02
-9.1%
jan 1, 1965
8.483
-1.712
-16.79%
jan 1, 1966
8.671
+0.189
2.22%
jan 1, 1967
8.56
-0.112
-1.29%
jan 1, 1968
7.704
-0.855
-9.99%
jan 1, 1969
7.2
-0.504
-6.54%
jan 1, 1970
6.873
-0.327
-4.54%
jan 1, 1971
8.99
+2.116
30.79%
jan 1, 1972
11.364
+2.374
26.41%
jan 1, 1973
11.98
+0.616
5.42%
jan 1, 1974
13.229
+1.25
10.43%
jan 1, 1975
14.915
+1.686
12.74%
jan 1, 1976
13.756
-1.159
-7.77%
jan 1, 1977
13.824
+0.068
0.49%
jan 1, 1978
12.866
-0.958
-6.93%
jan 1, 1979
10.572
-2.294
-17.83%
jan 1, 1980
8.201
-2.371
-22.43%
jan 1, 1981
15.729
+7.529
91.81%
jan 1, 1982
19.195
+3.466
22.03%
jan 1, 1983
22.602
+3.408
17.75%
jan 1, 1984
24.26
+1.657
7.33%
jan 1, 1985
29.823
+5.564
22.93%
jan 1, 1986
28.707
-1.117
-3.74%
jan 1, 1987
24.511
-4.195
-14.61%
jan 1, 1988
27.931
+3.419
13.95%
jan 1, 1989
28.614
+0.684
2.45%
jan 1, 1990
25.589
-3.025
-10.57%
jan 1, 1991
23.402
-2.187
-8.55%
jan 1, 1992
23.09
-0.312
-1.33%
jan 1, 1993
23.721
+0.631
2.73%
jan 1, 1994
24.708
+0.987
4.16%
jan 1, 1995
31.66
+6.951
28.13%
jan 1, 1996
33.835
+2.176
6.87%
jan 1, 1997
36.837
+3.002
8.87%
jan 1, 1998
39.413
+2.576
6.99%
jan 1, 1999
27.07
-12.344
-31.32%
jan 1, 2000
26.93
-0.139
-0.51%
jan 1, 2001
30.866
+3.935
14.61%
jan 1, 2002
37.108
+6.242
20.22%
jan 1, 2003
37.677
+0.57
1.54%
jan 1, 2004
38.479
+0.801
2.13%
jan 1, 2005
40.979
+2.5
6.5%
jan 1, 2006
39.391
-1.588
-3.88%
jan 1, 2007
42.402
+3.011
7.64%
jan 1, 2008
42.855
+0.454
1.07%
jan 1, 2009
45.732
+2.876
6.71%
jan 1, 2010
39.551
-6.18
-13.51%
jan 1, 2011
40.953
+1.402
3.54%
jan 1, 2012
48.498
+7.544
18.42%
jan 1, 2013
49.312
+0.815
1.68%
jan 1, 2014
49.008
-0.304
-0.62%
jan 1, 2015
50.05
+1.041
2.12%
jan 1, 2016
48.905
-1.144
-2.29%
Ranking of countries by current statistics by years


Comments: